



This is part of the Long Term Rentals in Denver→ [Long Term Rentals in Denver] a hub of Denver Investing Guide → [Denver Investing Guide]
Written by: Chad Cabalka
Turnover frequency profoundly erodes short-term rental (STR) margins in Denver by unleashing variable costs that scale exponentially with each guest cycle, often consuming 15–30% of gross revenue through cleaning, restocking, utilities, downtime, and accelerated wear. Hosts aggressively chasing 70–80% occupancy via 1–2 night stays trigger 25–35 turnovers monthly, where each reset demands $85–$140 in cleaning labor plus $25–$45 consumables—compounding to $2,800–$5,600 monthly before platform fees, taxes, or maintenance. Strategic hosts extending average stays to 4–7 nights cut turnovers to 12–16, diluting per-night costs by 40–50% and elevating net margins from 30% to 50%+, even accepting modest ADR dips. In Colorado’s Front Range—grappling with labor shortages, seasonal extremes, and stringent regulations—this metric separates break-even operators from equity-building investors.
Dissecting the Turnover Cost Cascade
Every guest departure launches a multi-layered expense chain invisible in gross revenue projections. Professional cleaning requires 3–6 hours: bathrooms sanitized, kitchens degreased, floors mopped/steamed, linens commercially laundered. Add restocking (toilet paper, soap, shampoo, coffee pods, trash bags), minor repairs (replacing burnt-out bulbs, patching wall scuffs, tightening hardware), and 6–12 hours of unrentable buffer for prep and inspection.
At Denver’s benchmark 65–72% occupancy, short-stay dominance (2.1-night average) yields 24 turnovers monthly:
- Direct Cleaning: $85–$140 × 24 = $2,040–$3,360
- Consumables/Supplies: $25–$45 × 24 = $600–$1,080
- Platform Fees (3–15% per booking): $300–$900 extra hit
- Downtime Loss: 8 hours × 24 = 192 hours/year ($1,500+ revenue opportunity)
- Utility Spikes: Guest laundry/HVAC pushes $100–$200/month
Total: $3,040–$5,640 monthly, or 22–32% of $17,000 annual gross from a typical 2-bed listing. Industry benchmarks confirm STRs average 48–62% operating ratios versus 32–38% for long-term leases, with turnover responsible for 60% of the delta.
Frequent cycles compound hidden depreciation: Colorado’s arid climate (humidity <30%) cracks wood cabinets and flooring under constant handling; snowmelt tracked indoors grinds thresholds; irregular thermostat use strains HVAC systems 25% faster, adding $600–$1,200 annual service calls.
Denver’s Turnover Intensity Amplifiers
Front Range conditions weaponize turnover beyond national norms, creating structural margin headwinds.
Labor Market Realities
Denver’s cleaning wages surged 14–18% since 2024 amid 120,000+ population influx and tourism rebound. Skilled teams command $30–$38/hour, booking 6–8 weeks ahead during peak May–October. Festival weekends (Red Rocks, Levitt Pavilion) overwhelm capacity, forcing hosts to accept subpar service, delay turnarounds (stealing 1–2 bookings), or slash rates 15–20% for urgency. Suburbs like Aurora face 25% longer wait times due to sprawl.
Seasonal Demand Fractures
- Peak Chaos (Jun-Aug): 65–72% occupancy floods calendars with 1–2 night event stays (Broncos, concerts, conventions), spiking turnovers to 32+. Gross revenue soars ($4,800/month), but costs balloon 2.5x.
- Winter Relief (Jan-Mar): Corporate relocations and government contracts favor 30–90 day blocks (38.7% of demand), slashing cycles to 5–7 monthly. Revenue dips ($2,700), but margins leap to 55%.
- Shoulder Traps (Apr-May, Sep-Oct): Hybrid demand confuses algorithms—hosts branded “weekend getaway” struggle pivoting to 7–14 night business travelers.
Regulatory Overhead
Denver’s STR ordinance mandates guest logs per turnover, 24/7 local response, and annual safety verifications. Noise complaints—tripling in high-turnover zones like Baker, RiNo, Jefferson Park—trigger $250–$2,500 citations plus investigation time (8–12 hours/case). Primary residence proof demands utility cross-checks; violations halt operations 3–6 months.
Suburban handcuffs
HOA-heavy enclaves (Highlands Ranch, Centennial, Littleton) prohibit hybrids, locking hosts into short-stay volatility. Older housing stock (pre-1980s bungalows) suffers disproportionate wear, with appraisals docking 6–12% for “STR fatigue.”
Biennial reassessments punish turnover-funded upgrades (furnishings, smart home tech), hiking taxes 12–22% on perceived value gains.
Granular Margin Erosion by Stay Length
| Avg Stay Length | Turnovers/Mo (70% Occ) | Direct Costs/Mo | Total Var Costs (% Gross) | Net Margin | Annual Net Gain vs Short |
|---|---|---|---|---|---|
| 1–2 Nights | 28–35 | $2,800–$5,250 | 28–35% | 25–35% | Baseline |
| 3–4 Nights | 18–22 | $1,800–$3,080 | 20–25% | 35–45% | +$3,600 |
| 5–7 Nights | 12–15 | $1,200–$2,100 | 14–18% | 45–55% | +$6,200 |
| 14–30 Days | 6–9 | $600–$1,260 | 8–12% | 55–65% | +$9,800 |
| 30+ Days | 3–5 | $300–$700 | 4–8% | 65–75% | +$12,500 |
Case Study: 2-bed LoHi condo, $215 ADR, 70% occupancy = $4,573 gross monthly.
- High Turnover (28 cycles): $3,360 cleaning + $840 supplies + $516 fees = $4,716 annual costs → $1,857 net (41% margin)
- Optimized (14 cycles): $1,680 cleaning + $420 supplies + $258 fees = $2,358 costs → $2,715 net (59% margin)
- Difference: $10,272 annual uplift—equivalent to 2.2% property yield.
Enterprise-Level Mitigation Framework
Pricing Engineering
Tiered minimums: 2 nights midweek, 3 weekends, 5 shoulder, 7 low-season, 30 winter. Bundle $45–$65 cleaning fees into base rates (amortized $8–12/night). Dynamic tools auto-lengthen stays during soft demand, boosting average 18–25%.
Operational Streamlining
- Vetted Crews: Lock 2–3 teams via retainer ($500/month priority). Standardize 3.5-hour checklists with apps (Turno, Breezeway).
- Tech Stack: Smart locks (Igloohome), keyless entry, noise monitors reduce coordination 60%. Bulk consumables (Costco runs) cut 35%.
- Self-Onboarding: Digital guides, stocked starter kits enable contactless handoffs.
Hybrid Revenue Architecture
- Peak STR (May–Oct): Maximize 2–4 night event arbitrage.
- Winter Mid-Term (Nov–Apr): Furnished Finder, corporate housing platforms capture 40% reliable bookings at 85–95% occupancy.
- Annual Savings: 42% fewer turnovers, +22% net margins.
Predictive Analytics
Track “turnover cost per occupied night” (target <$12–$15). Monthly RevPAR ÷ turnover ratio flags over-cycling. Benchmark against neighborhood medians (Capitol Hill: 26 turnovers; Aurora: 19).
Risk Transfer
STR-specific insurance ($1M+ liability, $2K–$5K premiums) covers guest damage during resets. Standard HO-3 policies void 28% of turnover claims.
Strategic Long-Term Implications
Unchecked turnover doesn’t merely thin margins—it systematically degrades capital. Accelerated depreciation slashes resale values 7–15% (“STR distressed” discount). Neighbor attrition fuels 311 complaints (20% tied to quick-turn parties), risking license revocation. Lenders scrutinize turnover intensity when qualifying supplemental income (75% gross, 24-month history).
Conversely, optimized operators (12–18 turnovers monthly) preserve pristine condition, command 5–8% appraisal premiums, and qualify for investment-property refis. Hybrid models align with Denver’s housing policy evolution—city planners eye STR caps amid 3.2% vacancy pressures.
Bottom Line for Denver Hosts
Turnover frequency converts Denver STR potential from high-volume opportunity to self-inflicted margin destruction without rigorous stay-length engineering. Elite hosts treat it as inventory optimization—extending cycles, streamlining resets, hybridizing seasons—unlocking 20–35% net uplift while safeguarding equity. The gap between chaotic 30-turnover operators and disciplined 12-turnover strategists compounds to $15,000–$25,000 annual divergence on median properties.
Reach out to me for your comprehensive turnover optimization roadmap: I’ll audit current cycles against 50+ comps, model pricing tiers, benchmark hybrid viability, map local labor partnerships, and pressure-test regulatory fit—delivering the executable blueprint to transform turnover from cost center to competitive edge in today’s maturing Front Range market.
Get the full Denver Market Insights → [Market Insights]


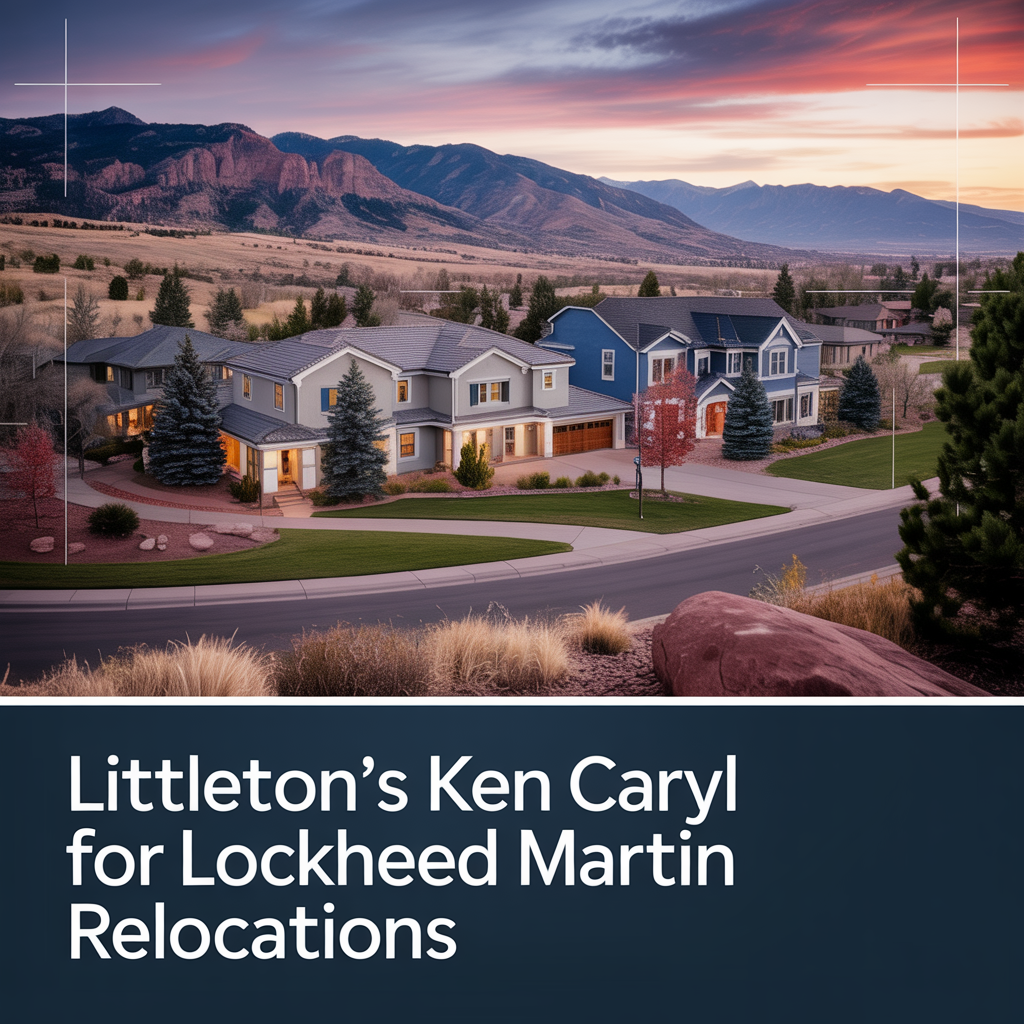
Littleton’s Ken Caryl for Lockheed Relocations
This is part of Lockheed Martin Relocation → [Lockheed Martin Relocation Hub] & the larger Denver Relocation Hub → [Denver Relocation Hub] Written by: Chad Cabalka Ken Caryl is one of the best-kept “family first” relocation options for Lockheed Martin employees who want foothills scenery, strong neighborhood appeal, and a real suburban lifestyle that still feels connected…


Centennial & Parker for Lockheed Relocations
This is part of Lockheed Martin Relocation → [Lockheed Martin Relocation Hub] & the larger Denver Relocation Hub → [Denver Relocation Hub] Written by: Chad Cabalka Centennial and Parker are two of the smartest suburban choices for Lockheed Martin employees relocating with families because they give you a strong balance of commute flexibility, good neighborhood variety, and…

Highlands Ranch for Family-Friendly Lockheed Relocations
This is part of Lockheed Martin Relocation → [Lockheed Martin Relocation Hub] & the larger Denver Relocation Hub → [Denver Relocation Hub] Written by: Chad Cabalka Highlands Ranch is one of the strongest choices for Lockheed Martin employees relocating with families because it delivers exactly what most parents want after a big move: stable neighborhoods, strong community…