


Mesa Lifestyle Guide → [Mesa Lifestyle Guide] & For more info on Mesa Real Estate → [Mesa Real Estate Guide]
Written by: Renee Burke
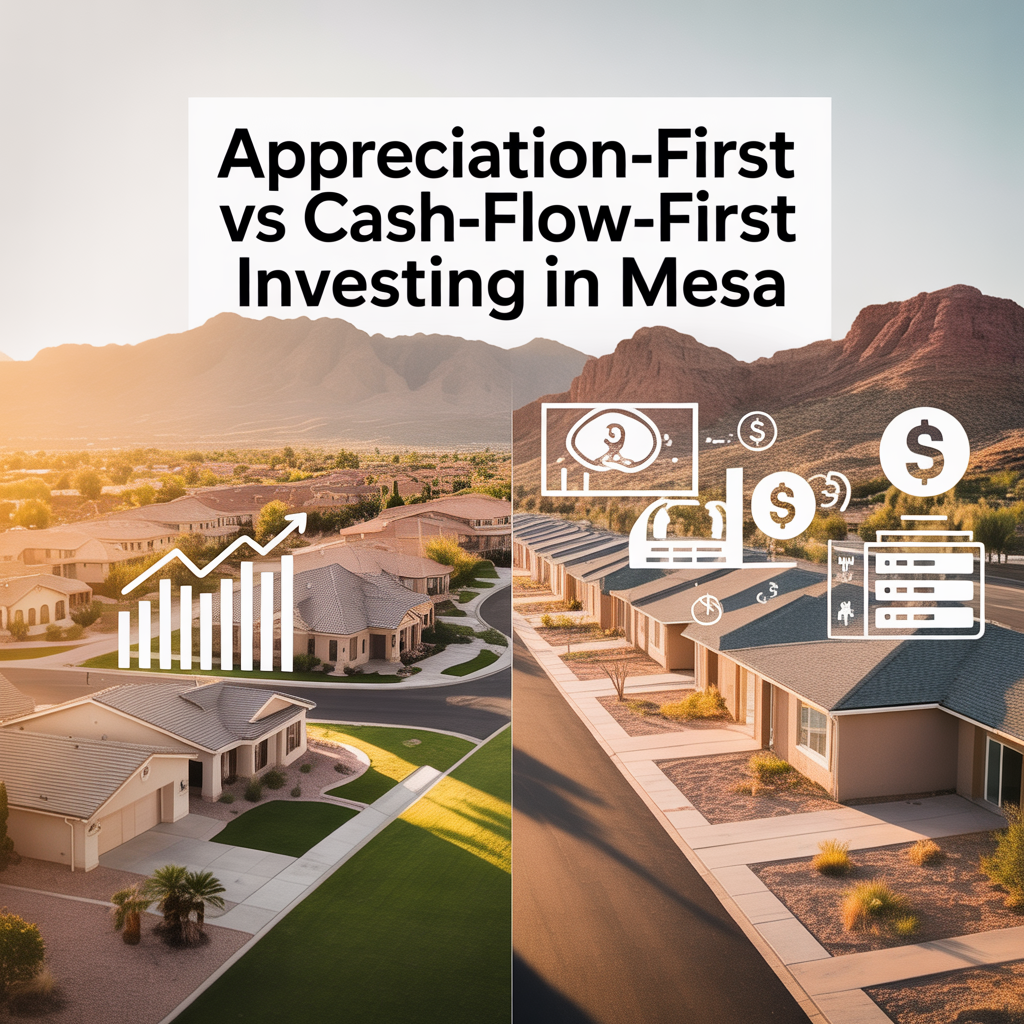
Mesa offers investors a clear fork in the road: chase appreciation in high-growth eastside pockets where values climb steadily, or prioritize cash flow in westside workhorses that cover mortgages from day one. Appreciation-first targets 5–8% annual gains in master-planned gems like Eastmark, banking on job booms and relocator influx; cash-flow-first squeezes 6–8% yields from older, affordable rentals near central hubs. Both leverage our balanced market—median $473K sales up 2.2% yearly, 3–3.5 months’ supply—but demand different timelines, risks, and stomach for upkeep.
I’ve guided portfolios through both, and matching your goals to Mesa’s rhythm makes all the difference.
Appreciation-First: Growth in Polished Enclaves
Focus here on southeast stars like Eastmark, Cadence, or Las Sendas, where newish builds ($450K–$600K) ride Gateway Airport expansion, top schools (85212 A-rated), and Loop 202 access. Values project 5–6% yearly through 2026, outpacing medians as families flock for amenities—resort pools, trails boosting 10–15% premiums. Low turnover (long-term owners) preserves scarcity; resale shines after 5–7 years as equity compounds.
Tradeoff: Negative or break-even cash flow initially ($2,200 rents barely cover $2,500 PITI at 6–7% rates). HOAs ($150–$300/month) and smaller lots pinch yields to 3–4%. Suits patient flippers or 1031 exchangers eyeing decade holds.
Cash-Flow-First: Income from Established Value Plays
West and central Mesa—Dobson Ranch, Lehi, westside 85204—deliver $1,800–$2,500 rents on $350K–$450K buys, netting 1–2% monthly after low 0.49% taxes ($1K–$1.5K/year). No-HOA flexibility attracts diverse tenants (airport workers, multi-gen); larger lots (8K+ sq ft) command steady $300–$500 spreads. Yields hit 6–8% with minimal vacancy (under 5%), covering maintenance while appreciation ticks 3–5%.
Catch: Higher capex—$3K AC cycles, pool care—erodes edges if neglected. Resale slower in revitalizing zones; quirkier layouts risk picky renters.
Head-to-Head Metrics
| Strategy | Best Neighborhoods | Entry Price | Rent/Mo | Yield | Appreciation (2026 Proj.) | Risk Profile |
|---|---|---|---|---|---|---|
| Appreciation-First | Eastmark, Las Sendas | $450K–$600K | $2,500–$3,500 | 3–5% | 5–8% | Rates, oversupply |
| Cash-Flow-First | Dobson Ranch, Lehi | $350K–$450K | $1,800–$2,500 | 6–8% | 3–5% | Maintenance, turnover |
Market Forces Shaping Each Path
Balanced inventory (62 DOM median) favors cash-flow buys—negotiate 2–5% off in westside flips. Appreciation shines on eastside momentum: relocators (net inflow top-10 metros) and tech/logistics jobs fuel demand. Both benefit from stable taxes and no state income tax, but appreciation bets on limited land; cash flow weathers softening rents (-1–2% yearly).
Hybrid wins: Lehi acreage blends 5% yields with upside; Desert Uplands luxury yields 4% but pops 6–7%.
Risks and Exit Strategies
Appreciation risks rates spiking (6–7% holds) or new-build floods cooling premiums; exit via forced appreciation (kitchens boost 15%). Cash flow falters on vacancies (westside noise) or capex overload—mitigate with $10K reserves. Long-term, both ride 7–8% decade trends, but cash flow funds life now; appreciation builds legacies.
Crafting Your Mesa Play
Appreciation suits horizon planners; cash flow fits income seekers. Mesa’s diversity lets you mix—westside starter feeding eastside growth.
If you’re thinking about making a move in Mesa, you don’t have to figure it out alone. Let’s align your timeline and risk with the right strategy, turning numbers into neighborhood fits. I’m here as your East Valley guide, ready to map steady wins.
Get the full Phoenix Market Insights → [Market Insights]

-
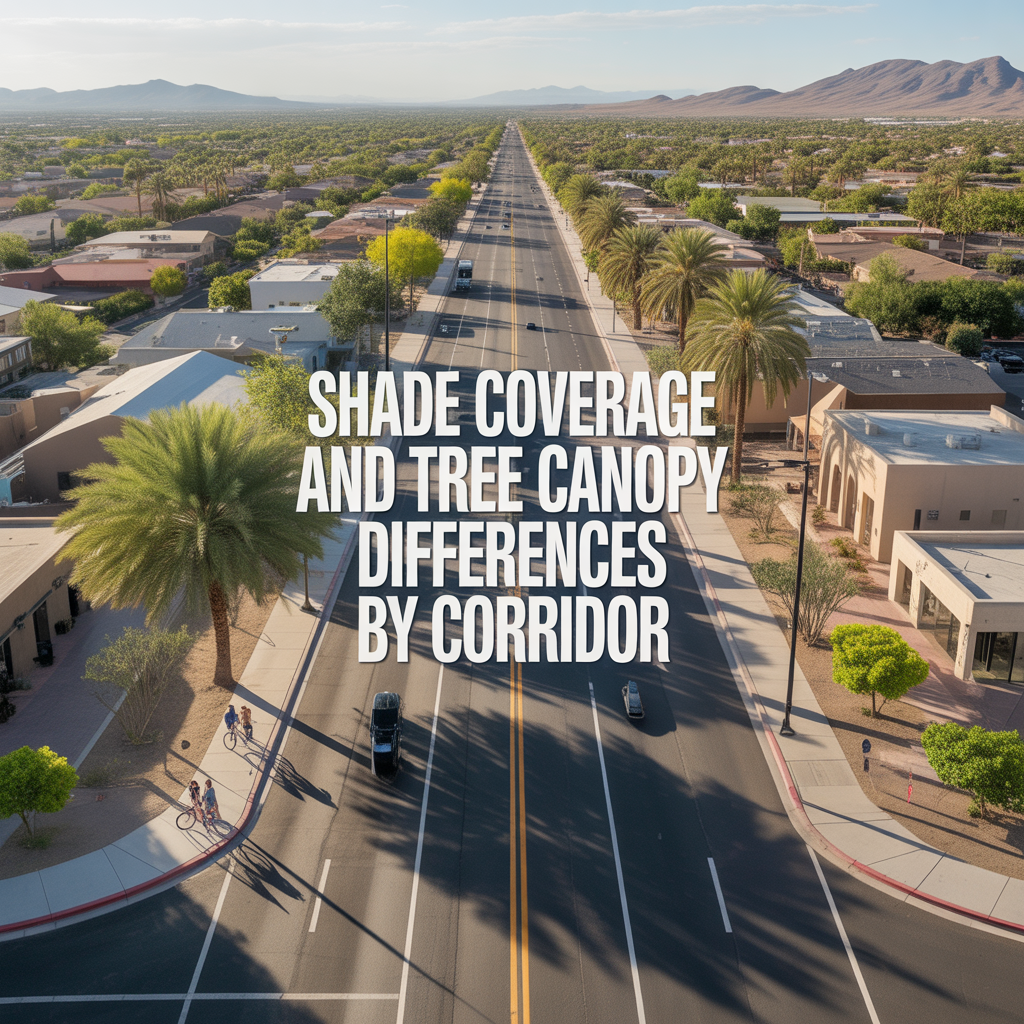
Shade Coverage and Tree Canopy Differences by Corridor
-

Summer Walkability Reality Near ASU and Mill Avenue
-
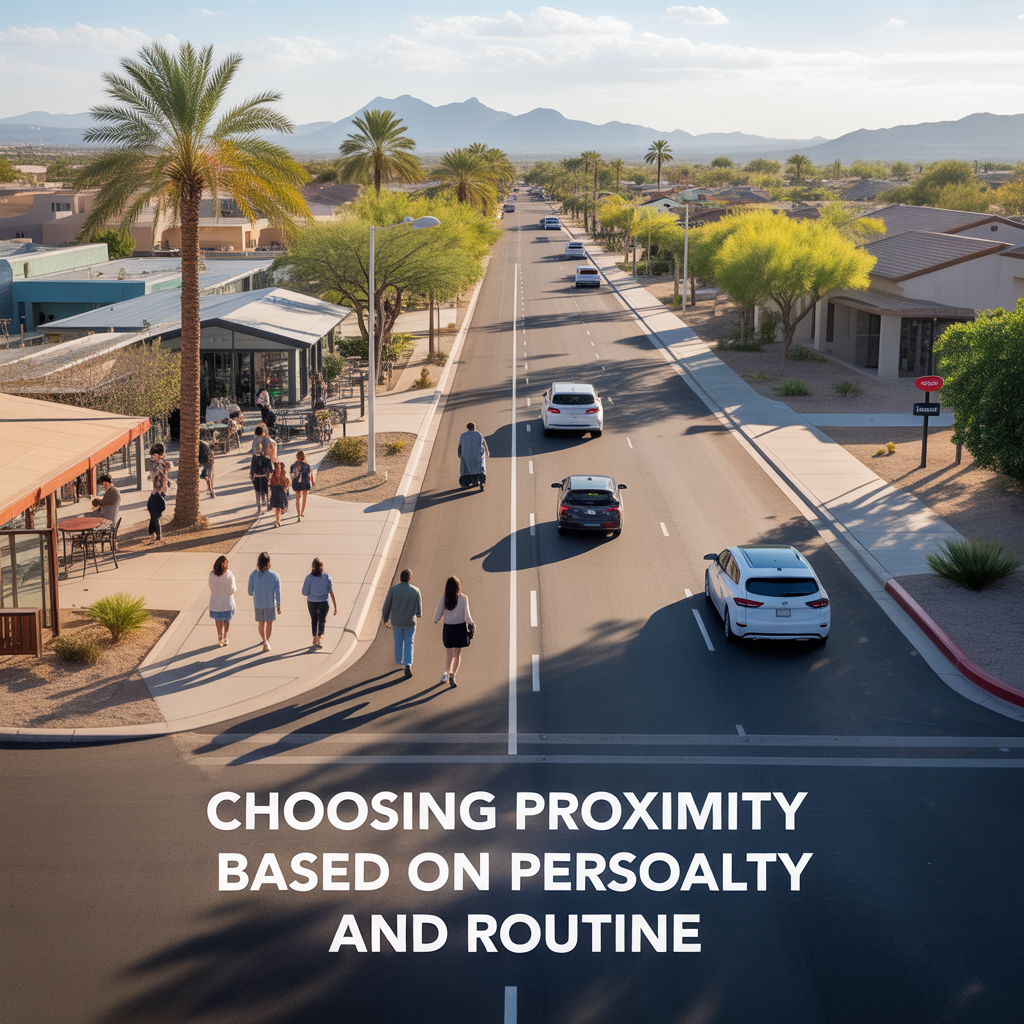
Choosing Proximity Based on Personality and Routine
-
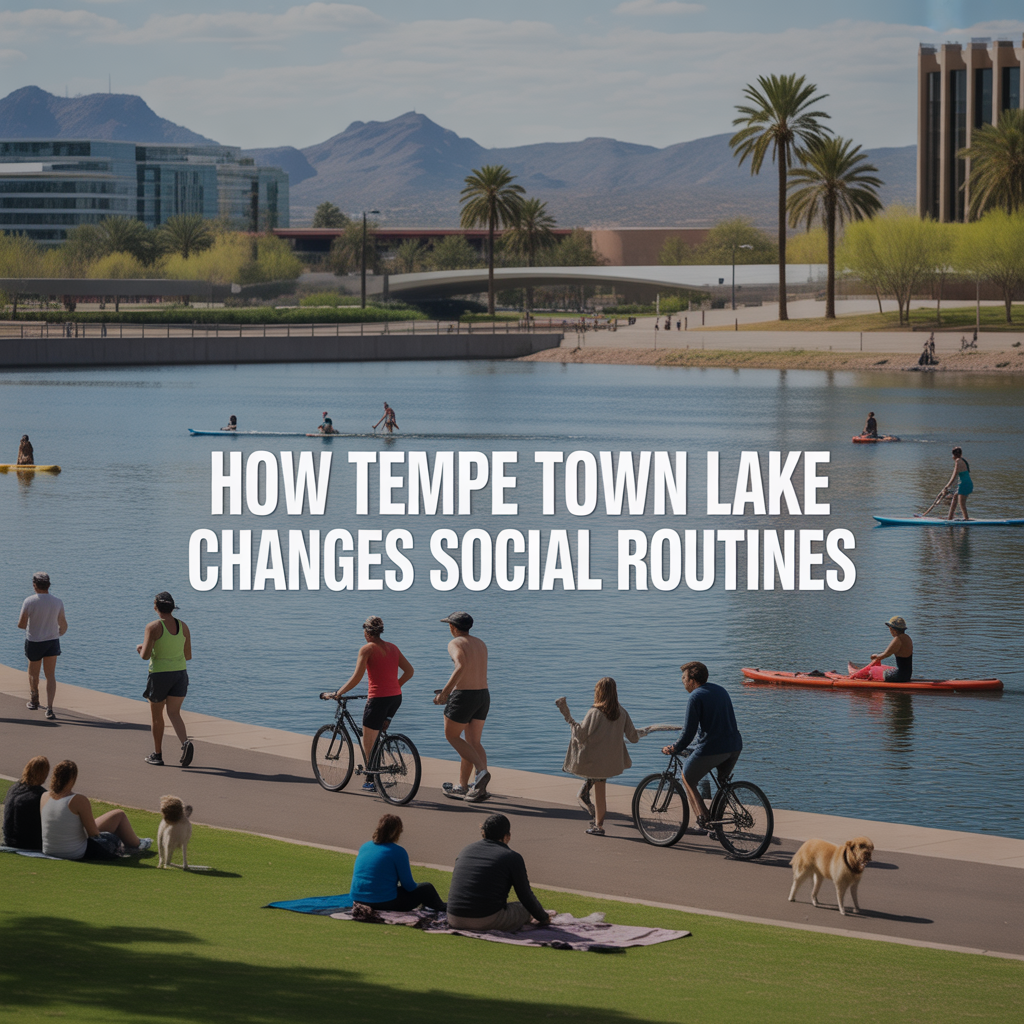
How Tempe Town Lake Changes Social Routines
-
Family-Friendly Lake Events vs Adult Nightlife Patterns
-
Parking Structures and Rideshare Realities on Peak Nights
-
Mill Avenue Late-Night Hotspots vs Residential Calm
-

ASU Game Days and Event Calendar Impacts
-
Cross-Valley Trip Efficiency From Tempe
-
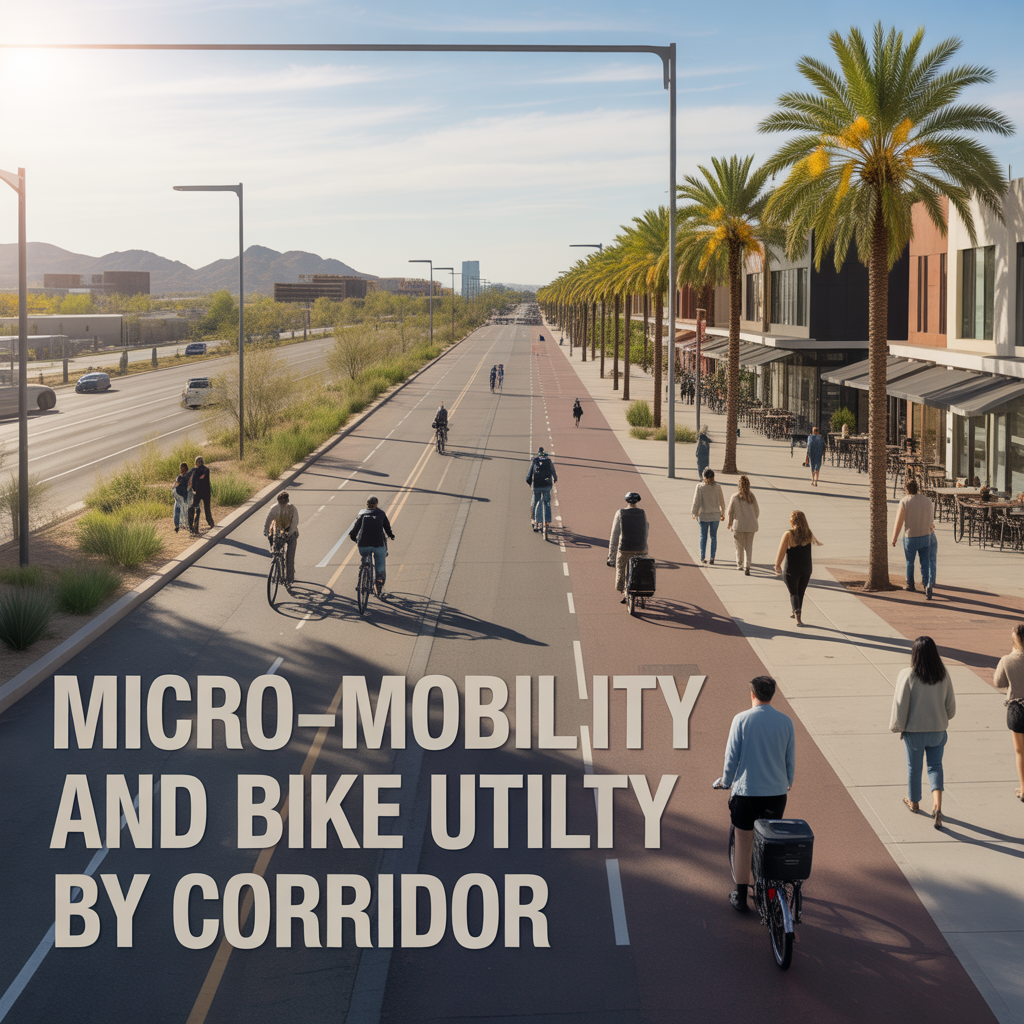
Micro-Mobility and Bike Utility by Corridor
-

Park-And-Ride, Game Day, and Event Access Patterns
-
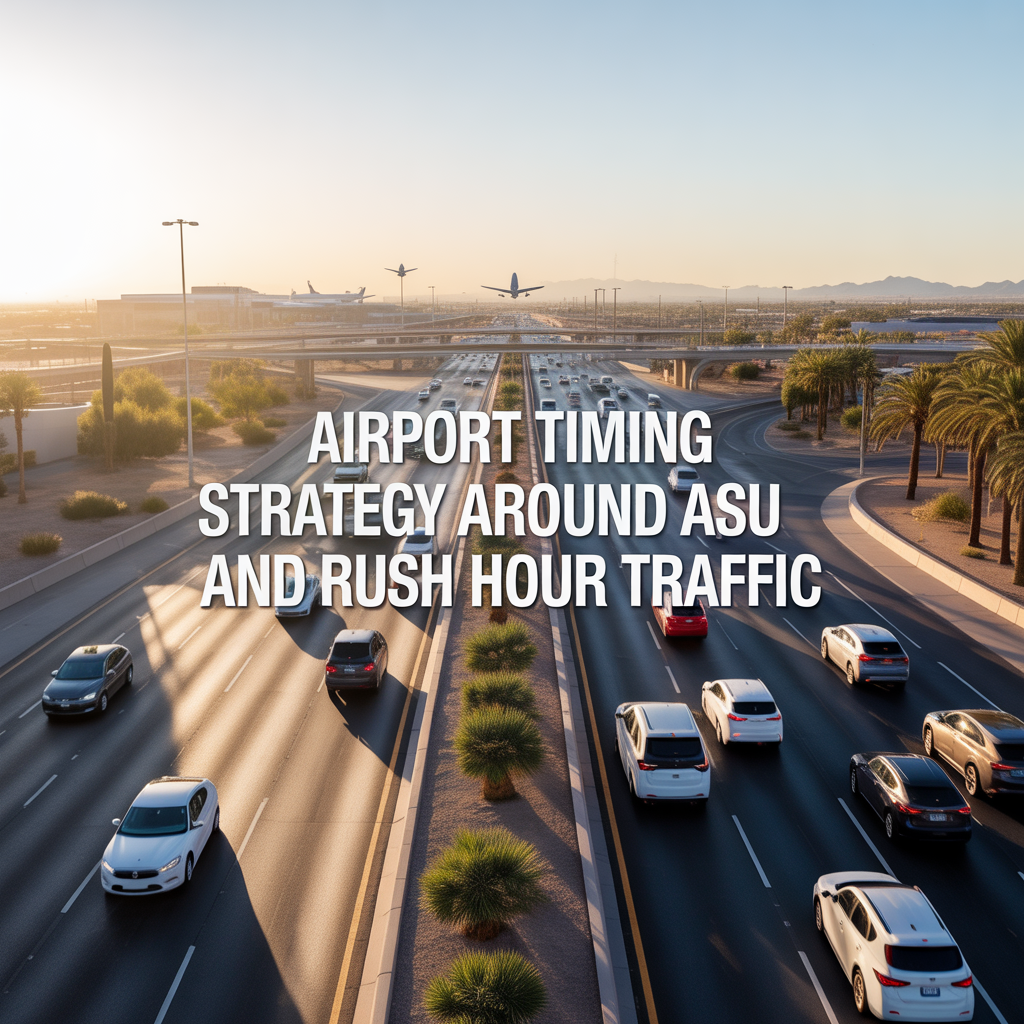
Airport Timing Strategy Around ASU and Rush Hour Traffic
-

Light Rail Use Cases That Actually Improve Daily Life
-
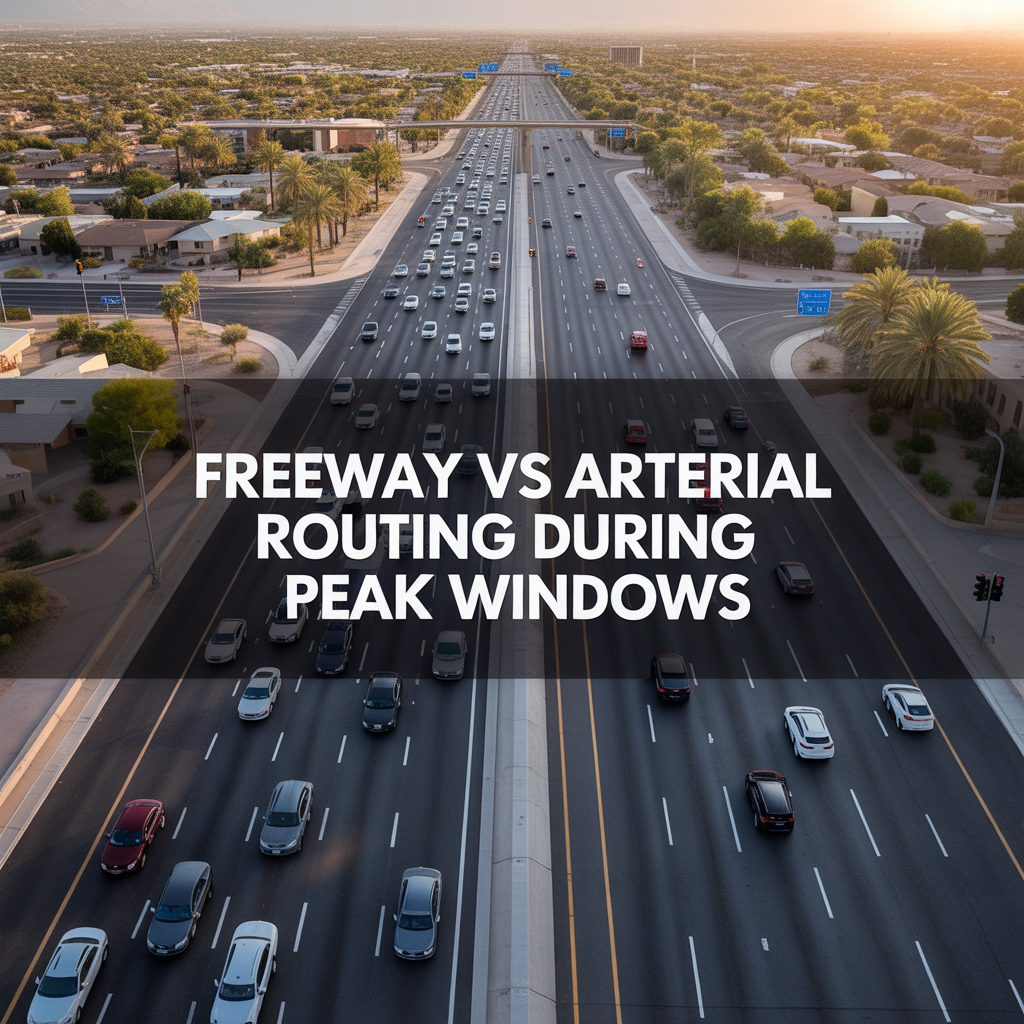
Freeway vs Arterial Routing During Peak Windows
-

Real-World Drive Times to Sky Harbor From Different Tempe Pockets
-
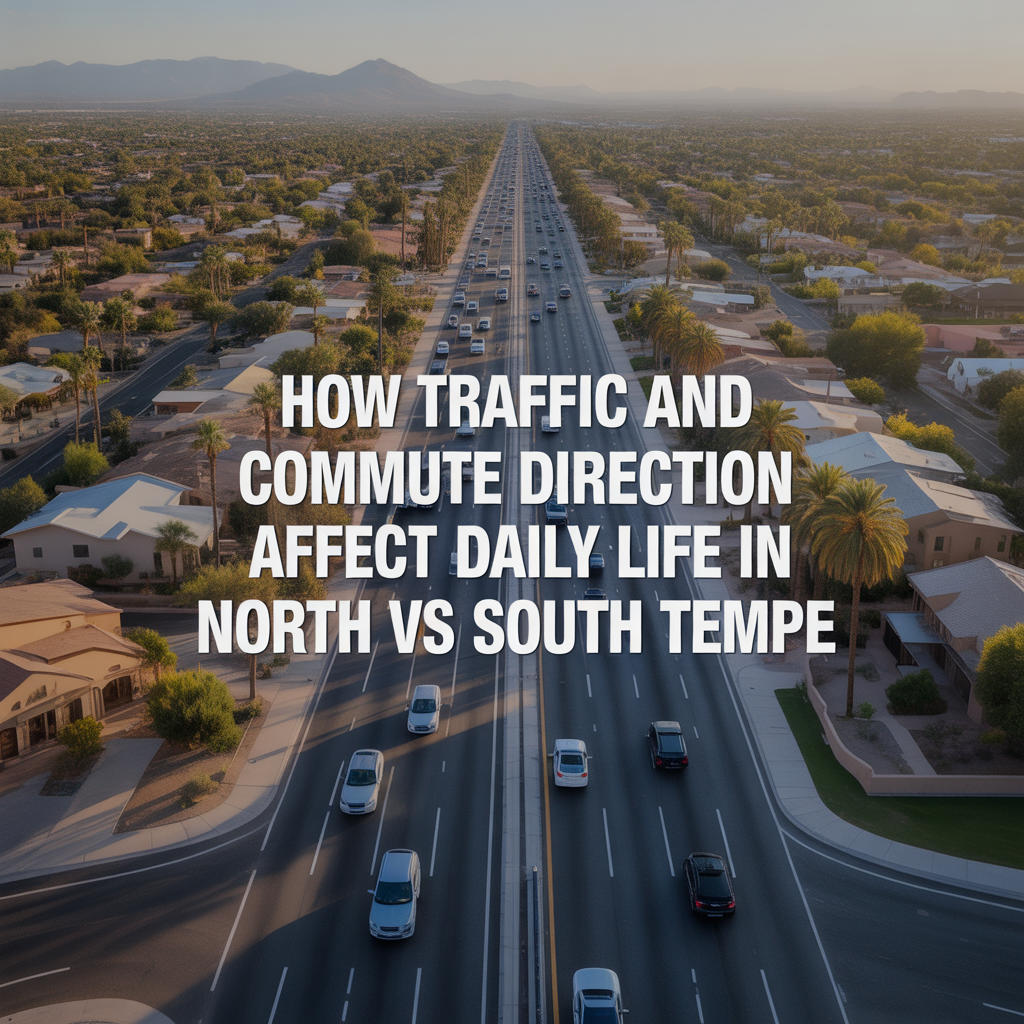
How Traffic and Commute Direction Affect Daily Life in North vs South Tempe
-

Bike Paths, Walkability, and Short-Distance Transportation in Tempe
-
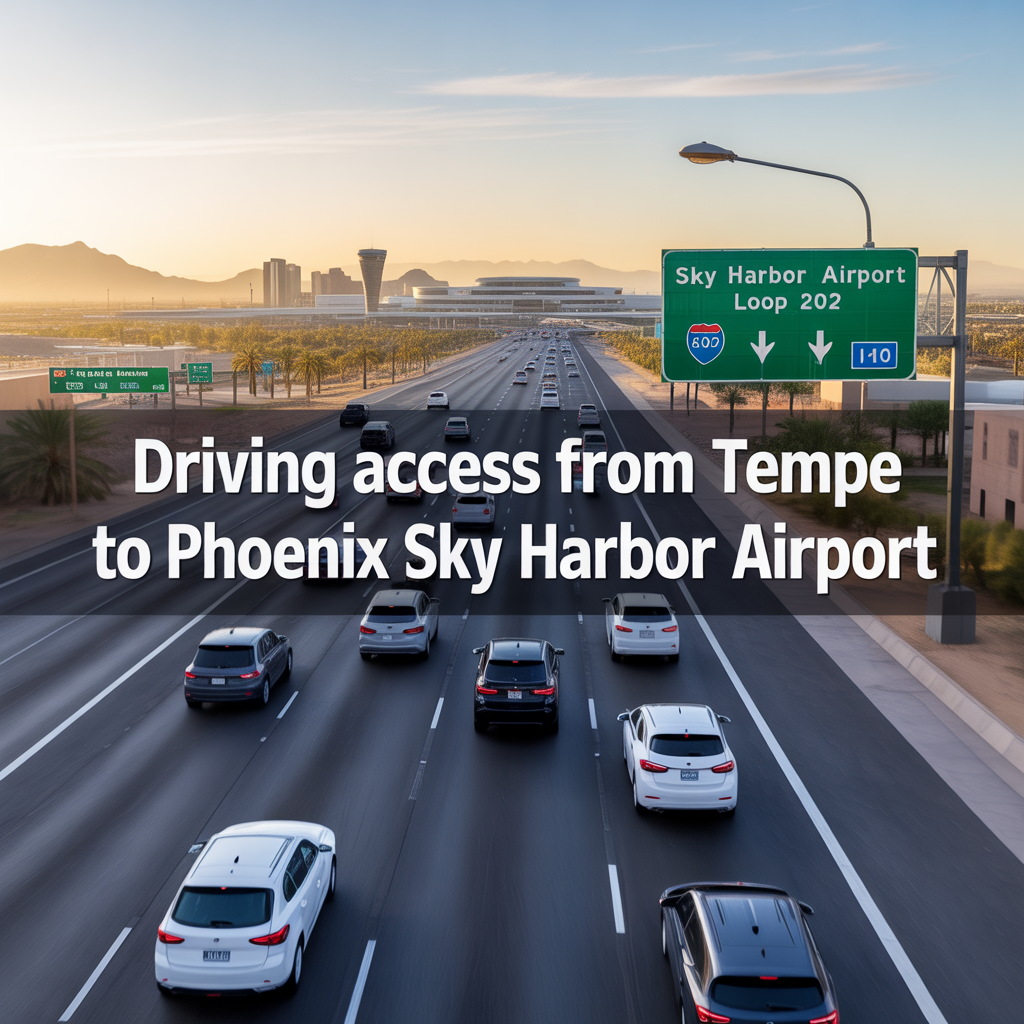
Driving Access From Tempe to Phoenix Sky Harbor Airport
-
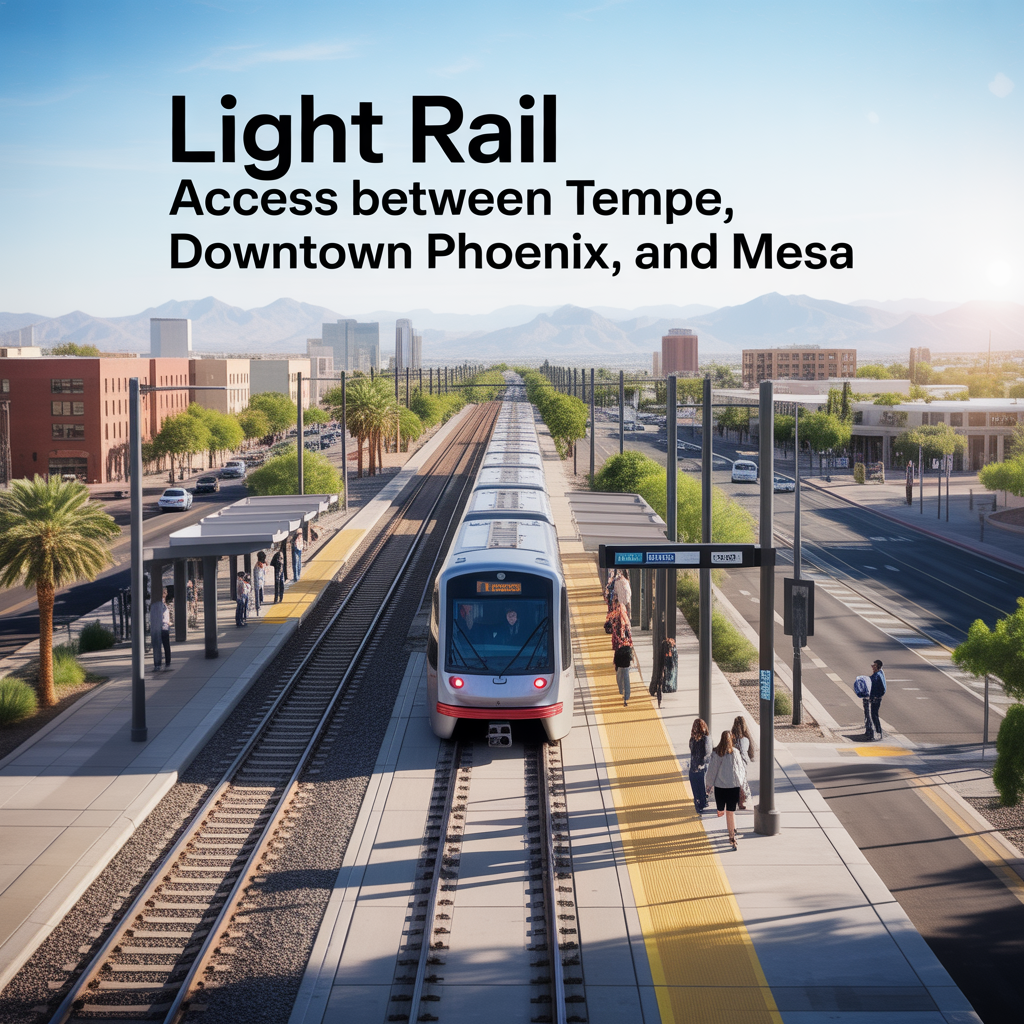
Light Rail Access Between Tempe, Downtown Phoenix, and Mesa
-
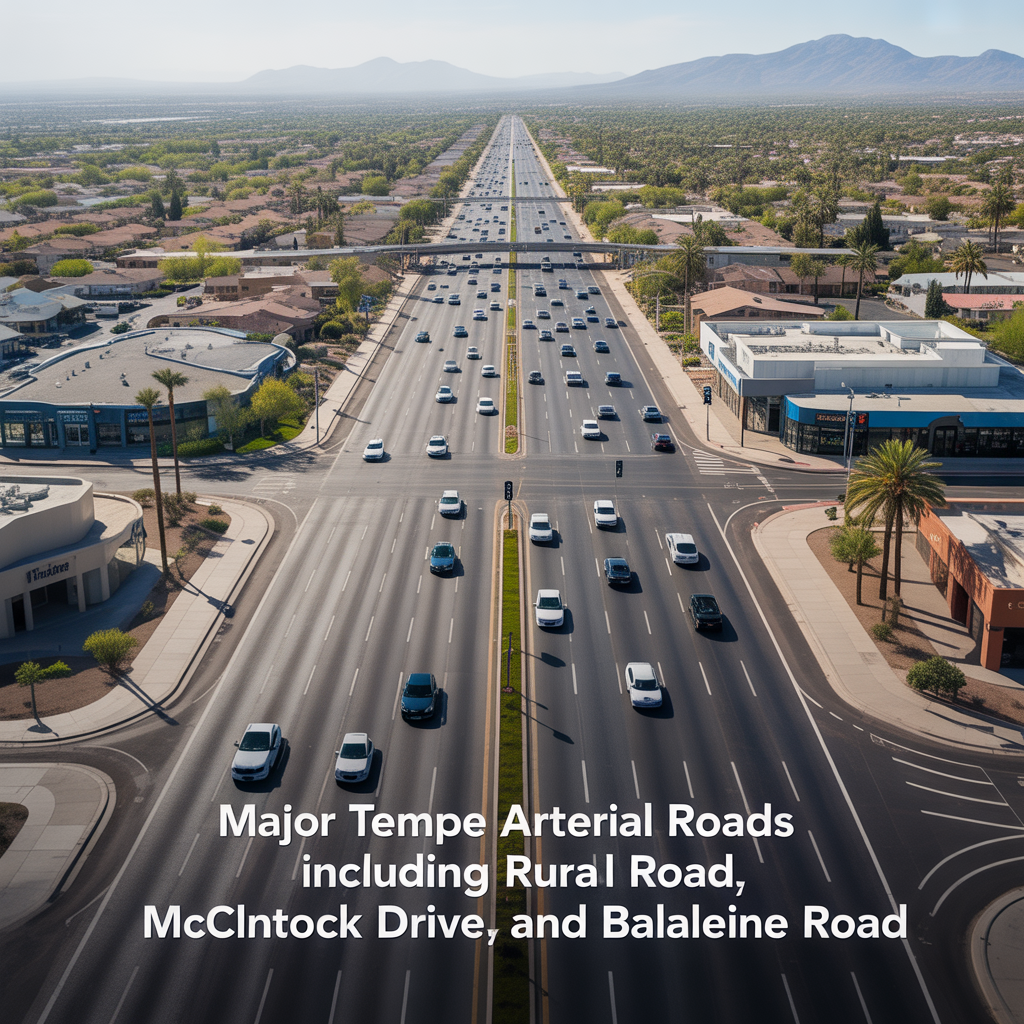
Major Tempe Arterial Roads Including Rural Road, McClintock Drive, and Baseline Road
-
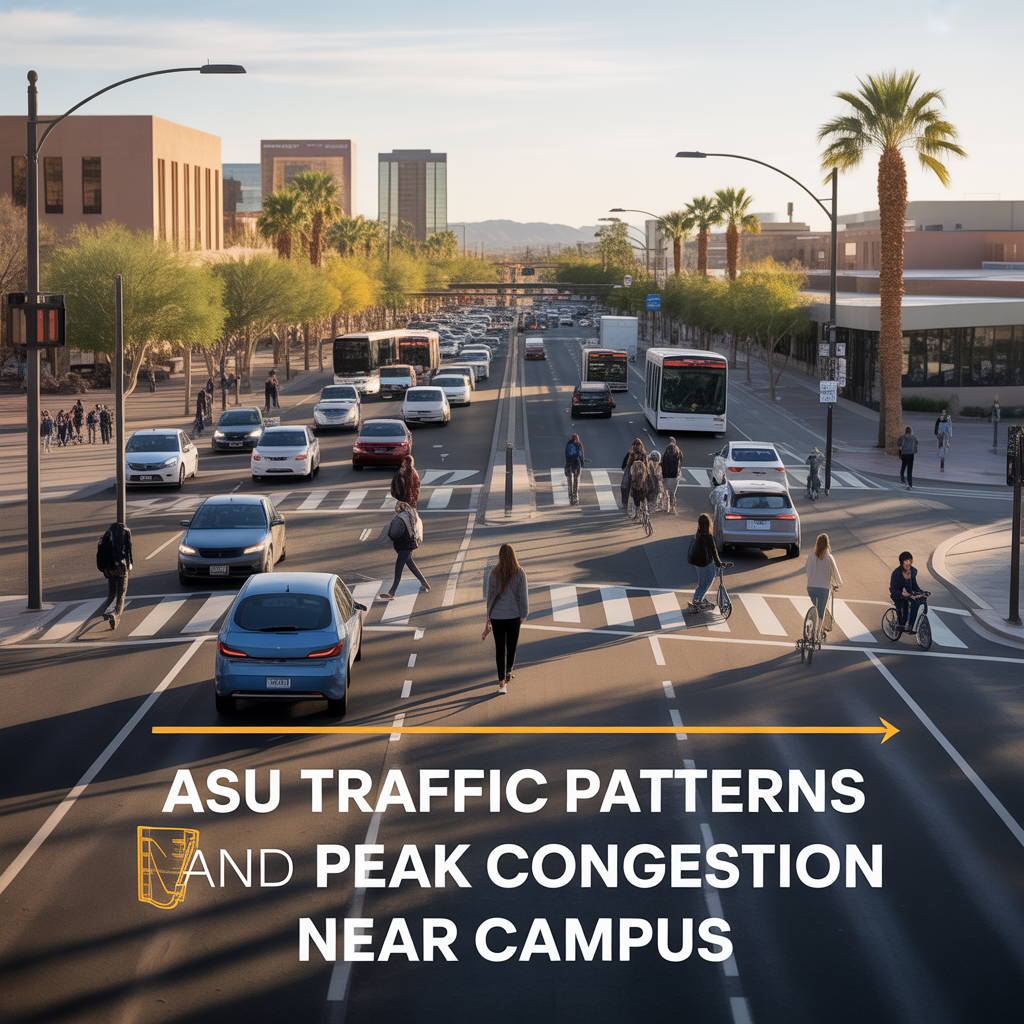
ASU Traffic Patterns and Peak Congestion Near Campus
-

Typical Commute Times From Tempe to Phoenix, Scottsdale, and Chandler
-
Tempe Freeway Access to US-60, Loop 101, and Loop 202
-
Shade, Tree Coverage, and Summer Outdoor Usability in Tempe
-

Outdoor Recreation Near Downtown Tempe and ASU