


Mesa Lifestyle Guide → [Mesa Lifestyle Guide] & For more info on Mesa Real Estate → [Mesa Real Estate Guide]
Written by: Renee Burke
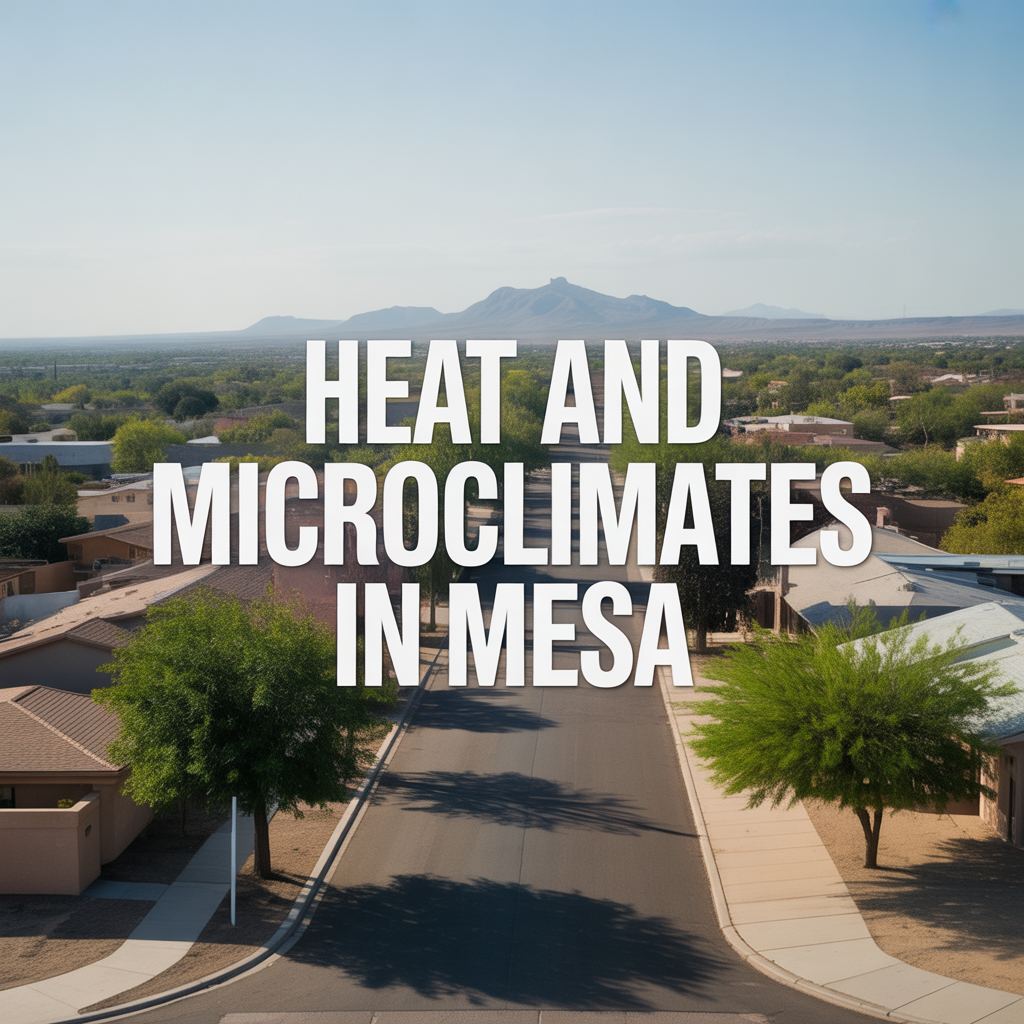
Mesa’s desert climate wraps you in nearly year-round sunshine, but that warmth comes with layers of variation — from scorching summer peaks that reshape your daily plans to surprising pockets of cool relief hidden in neighborhoods and natural features. Living here means learning how heat flows differently across the East Valley, influenced by elevation, urban sprawl, open spaces, and even the Superstition Mountains casting shadows at just the right times. I’ve watched families adjust their routines over the years — morning hikes in cooler northeast pockets, afternoon splashes in shaded central parks — turning what could be overwhelming into a rhythm that feels natural and even refreshing once you understand the microclimates at play.
These subtle differences aren’t just trivia; they shape where you choose to live, when you step outside, and how your home stays comfortable through 110°F days. Mesa’s average annual temperature hovers around 85°F, with over 300 sunny days, but July and August routinely top 106°F highs while nights barely dip below 80°F. Low humidity keeps it dry rather than sticky, yet urban heat islands, elevation shifts, and green spaces create real variation — some areas feel 5-10°F cooler (or hotter) block by block. No need for complicated science; let’s walk through how heat plays out by neighborhood, with practical ways it affects family life, home choices, and those joyful outdoor moments we all crave here.
The Baseline: Mesa’s Desert Heat Patterns
Mesa sits at about 1,240 feet elevation in the Sonoran Desert, baking under intense sun from May to September with averages climbing from 92°F in May to 104°F in July. Winters gift mild 65-75°F days (lows 35-45°F), perfect for park picnics, while spring and fall offer 75-90°F sweet spots for trails. Monsoons (July-September) add brief humidity spikes (40-50%), occasional rain cooling things 5-10°F temporarily, but mostly they trap heat overnight.
What makes Mesa unique are microclimates — small zones where temperature, wind, shade, and moisture differ due to terrain. Northeast areas near mountains catch breezes and shade, dropping 3-7°F cooler than central asphalt jungles. Open east washes vent heat better than dense west neighborhoods. Urban heat islands (concrete absorbing sun) push downtown 2-5°F hotter midday; parks and lakes cool surrounding blocks 1-4°F via evaporation. Families feel it daily: a Dobson Ranch backyard might hit 108°F feels-like, while Eastmark’s lake paths stay 102°F with mist.
West and Central Mesa: Urban Heat with Park Relief
West Mesa (85201-85204, downtown/Fiesta) and central areas like Dobson Ranch bake most intensely due to buildings, roads, and malls trapping heat — midsummer highs feel 3-5°F warmer from concrete radiation. Superstition Springs Center’s parking lots hit 120°F surfaces, nudging nearby homes hotter till evening breezes kick in around 7 p.m.
Microclimate saviors: Pioneer Park’s tree canopy and splash pad cool blocks 2-3°F via shade/evaporation — mornings here feel 5°F milder under ramadas. Riverview Park’s river proximity drops adjacent Dobson yards 1-4°F cooler, misty evenings extending playtime. Fiesta’s murals and markets add airflow, but dense grids slow cooling. Families adapt: pre-9 a.m. playgrounds, post-6 p.m. tacos at Chiwas (patio misters help). Homes benefit from mature trees (cooler yards), but AC runs harder ($150-250 summer bills).
Tradeoffs: Vibrant walkability trades sun-baked afternoons for shaded urban oases — perfect for city lovers, tougher for heat-sensitive kids.
Superstition Springs and Dobson Ranch: Suburban Heat Traps and Canal Breezes
Central corridors (85205-85206) mirror west intensity but soften with canals and fields. US-60 asphalt radiates extra heat, pushing feels-like 110°F+ afternoons, yet canal paths along Dobson Ranch create shaded microclimates 4-6°F cooler — cottonwoods trap moisture, breezes flowing east-west. Countryside Park’s meadows vent heat better than malls, dropping nearby homes 2°F milder evenings.
Riverview’s Salt River edge cools a 1-mile radius (evaporative drop), playgrounds feeling 3°F fresher misty mornings. Families thrive: 7 a.m. canal walks to Brisas school, 5 p.m. riverside picnics post-Taylor Junior High. Established ranches ($400K) with big trees shade patios naturally, easing AC loads. Monsoons amplify canal humidity slightly, but overall dry air prevails.
Tradeoffs: Reliable routines near malls/schools, but midday asphalt demands indoor breaks — ideal for busy parents stacking errands.
Eastmark and Cadence: Master-Planned Cooling Design
Eastmark’s genius lies in engineered microclimates — 75+ parks, lakes, and washes create a 2-5°F cooler bubble than central Mesa. Audain Great Park’s water features and trees cool surrounding blocks via evaporation/shade, mornings feeling 98°F when Power Road bakes 105°F. Neighborhood paths with misters extend usability, Newton Park’s splash zones dropping local feels-like 4°F.
Cadence east mirrors with turf fields venting heat, lakes reflecting sun away. Homes ($450K+) incorporate shade sails, drought-tolerant yards staying 3°F cooler. Families love dawn lake laps (herons bonus), dusk fire pits — BASIS walks dodge peak sun entirely. HOAs fund misters/trees, summer bills dip $50/month vs. west.
Tradeoffs: Polished paradise for routines, but HOA rules limit personal landscaping — walkable joy outweighs for most.
Northeast Mesa (Las Sendas, Red Mountain Ranch): Mountain Microclimate Magic
Northeast shines coolest — elevation (1,500-2,000 ft) and Superstitions drop temps 5-10°F below central averages. Las Sendas foothills catch upslope breezes, yards feeling 100°F when Dobson hits 108°F; nights cool to 75°F vs. 82°F. Red Mountain buttes shade afternoons 2-3 hours earlier, Usery trails misty mornings (mountain runoff).
Red Mountain Park fields stay 4°F milder under trees, Apache washes venting heat overnight. Gated estates ($550K+) back to trails, natural shade easing AC 20%. Families hike Wind Cave pre-9 a.m. (10°F cooler at summit), Zaharis playgrounds fresh till noon. Monsoons bring more rain here, greening microclimates.
Tradeoffs: Rugged bliss for adventurers, but 15-minute mall drives — nature therapy trumps convenience.
Gateway and Far East: Open Desert Venting
Far east feels rawest — sparse development lets heat vent, washes cooling 3-5°F via airflow. Signal Butte Park fields bake less than malls, Hawes trails shaded canyons dropping 7°F. Gateway Airport edges add jet-blast warmth near runways, but open skies cool nights fastest (70°F lows).
New builds chase affordability, yards with ramadas mimicking northeast shade. Families tube Salt River (river drop 5°F), Lehi Sports Park evenings fresh.
Tradeoffs: Intensity vs Intention
West urban traps heat (hotter days, $200+ AC); east mountains vent (cooler, cheaper bills). Parks/lakes cool 1-5°F radius — prioritize tree-lined. Monsoons humidify central more. Homes test: midday thermometer walks.
| Area | Heat Intensity | Microclimate Cooling | Family Routine Fit |
|---|---|---|---|
| West/Central | High (UHI +3-5°F) | Parks/canals (2-4°F) | Shaded urban play |
| Eastmark | Medium | Lakes/parks (3-5°F) | Walkable mists |
| Northeast | Low (elev +5-10°F) | Mountains/breezes | Trail mornings |
| Gateway East | Medium-High | Washes/open sky | River escapes |
Growth adds shade sails 2026.
Heat’s Gentle Lessons
Microclimates make Mesa livable — northeast breezes for hikes, park mists for kids. Adapt: dawn routines, hydrated yards.
If Mesas heat variations spark questions for your home hunt — cooler pockets or shaded yards — you dont have to figure it out alone. Ive matched families to climates that comfort.
Reach out anytime — lets find your cool corner. Here, even heat holds hidden relief.
Get the full Phoenix Market Insights → [Market Insights]

-

Federal Housing Supply Initiatives And Their Downstream Impact On Phoenix Development
-

National Housing Supply Initiatives And Builder Expansion In Arizona
-

Federal Economic Policy And Its Influence On Relocation Buyer Confidence
-
Institutional Investment Narratives And Their Impact On Phoenix Inventory Pressure
-

Immigration And Domestic Migration Trends Driving Phoenix Housing Demand
-

Why National Lending Standards Quietly Shape Buyer Competition Across The Valley
-

How Federal Reserve Interest Rate Policy Changes Monthly Affordability In Phoenix
-

Understanding The Limits Of Local Policy On Long-Term Property Value
-
Micro-Location Factors That Outperform Policy Narratives In Phoenix Real Estate
-

Why Lifestyle Preferences Still Drive Phoenix Home Values More Than Policy
-
Seller Strategy In Phoenix Neighborhoods Influenced By HOA Or Policy Shifts
-
Investor Behavior Trends Linked To STR Enforcement And Rental Rules
-

Why Policy Stability Drives Demand In Certain Phoenix Submarkets
-

How Water Headlines Affect Phoenix Relocation Buyer Decisions
-

Insurance Market Pressure And Legislative Conversations Around Climate Risk In Arizona
-
Property Tax Policy Discussions And Long-Term Ownership Cost Projections In Phoenix
-

Build-To-Rent Expansion And Political Pushback Across Maricopa County
-

Heat Mitigation And Shade Requirements Increasing Construction Costs In Phoenix
-
Short-Term Rental Law Conflicts Between Arizona State Policy And Local Enforcement
-
Arizona Housing Supply Legislation And Density Policy Debates Affecting Phoenix Inventory
-

HOA Dues, Reserve Requirements, And Financial Health Across Phoenix Neighborhoods
-

Insurance Cost Trends Across Phoenix And How Policy Conversations Influence Premiums
-
Arizona Rental Tax Changes And What Investors Need To Know In 2026
-
Community Facility Districts, Special Assessments, And Hidden Costs In New Communities
-

Arizona Property Tax Structure And How Assessed Value Caps Affect Phoenix Homeowners