


Mesa Lifestyle Guide → [Mesa Lifestyle Guide] & For more info on Mesa Real Estate → [Mesa Real Estate Guide]
Written by: Renee Burke
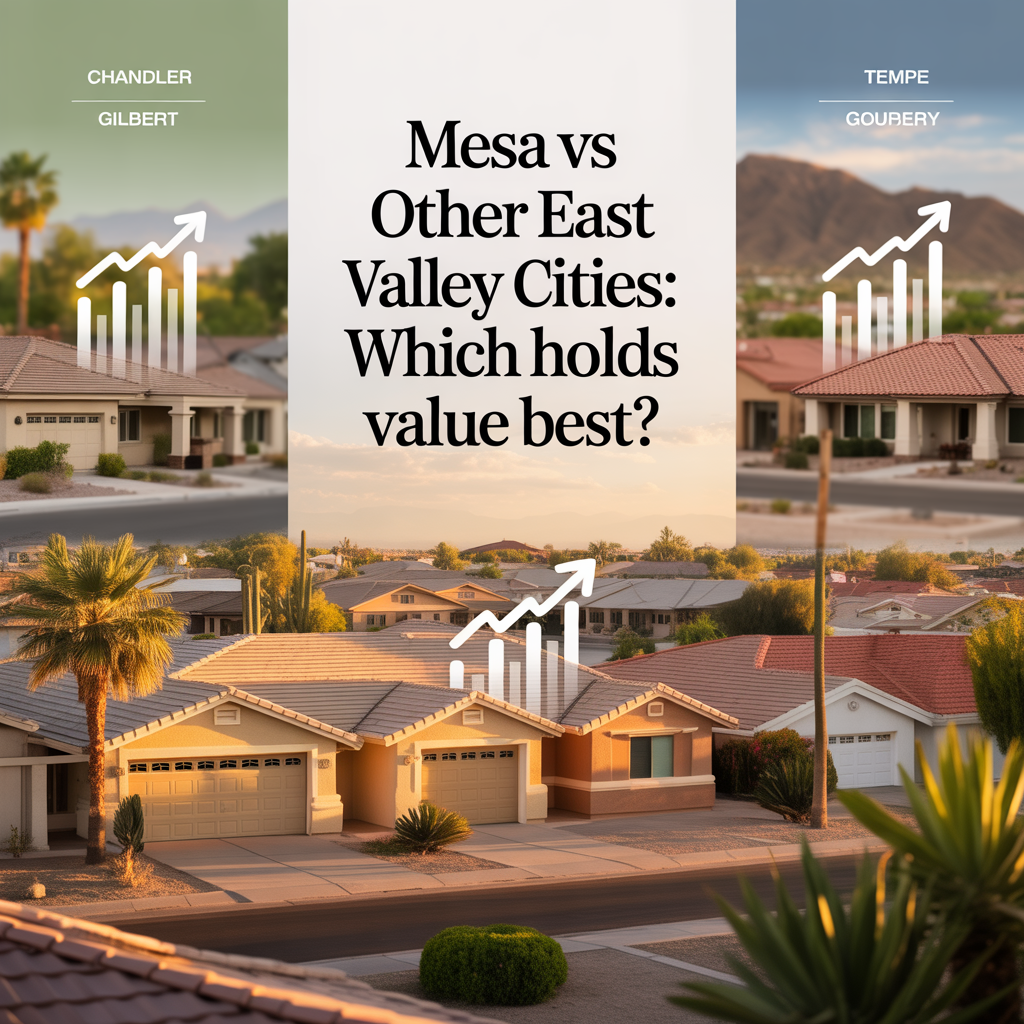
Mesa doesn’t always grab the headlines like its East Valley neighbors, but when it comes to holding value over time, it has a quiet edge that I’ve seen play out time and again. While Gilbert polishes its family-perfect image, Chandler leans on corporate jobs, and Queen Creek races toward the horizon, Mesa offers a balanced mix of affordability, central access, and steady demand that keeps equity building without the drama. It’s the kind of reliability that lets you focus on life, not market swings.
Let’s break it down thoughtfully, building on our chats about Mesa’s evolution, underrated neighborhoods, and investment strength.
Price Stability and Appreciation Track Record
Mesa’s medians hover around $445,000–$473,000, with recent 2–3% growth settling into a projected 3–6% annually—resilient without overheating. Over the last decade, it’s delivered 7–8% compounded returns, turning 2016 buys under $230,000 into today’s solid equity. Westside revitalization in spots like Dobson Ranch cushions dips, while eastside like Eastmark captures upside.
Gilbert’s $550,000+ prices promise similar 3–5% gains but demand perfection—tight inventory leaves less room for error. Chandler’s $500,000 average holds 4–5% via Intel stability, yet it’s tethered to employment cycles. Queen Creek’s $575,000 peak cooled 2–4% amid new-build floods, risking overextension for long holds.
Mesa shines in value retention: lower entry points and diverse demand mean smoother rides through rate hikes or slowdowns.
Inventory Dynamics and Buyer Leverage
Mesa’s 3–3.5 months’ supply and 50–60 days on market create breathing room—buyers negotiate without frenzy, unlike Gilbert’s brisker 40 days. Chandler matches at 3 months, but Mesa’s light rail and Loop 202 draw wider pools, stabilizing volume. Queen Creek’s 4+ months signals caution for resale pressure.
This balance preserved value post-2022 boom (40% jumps) and 2025 softening (-1–3%). No wild oversupply here—just measured growth.
Rental Strength and Cash Flow Reliability
Yields of 4–6% in Lehi or Red Mountain Ranch make Mesa a rental standout—$2,500–$4,000 rents cover costs amid low 5% vacancies. Gilbert’s 4–5% comes at higher premiums, Chandler’s 5% suits pros but HOA fees bite ($200+/month). Queen Creek’s 3–5% bets on growth over income.
Mesa’s underrated gems like Desert Uplands or Mulberry blend family appeal with Gateway jobs, ensuring tenants stay.
Lifestyle Anchors and Demand Drivers
Mesa’s mix—downtown arts, Usery hikes, central vibe—pulls retirees, families, and commuters alike. It sidesteps Gilbert’s uniformity, Chandler’s work focus, and Queen Creek’s sprawl. Top schools rival peers, parks outshine, and 15–20% population growth since 2016 locks in buyers.
Taxes at 0.49% effective rate keep ownership light across the board.
| City | Median Price | 10-Yr Appreciation | Rental Yield | Supply (Mos) | Value Hold Strength |
|---|---|---|---|---|---|
| Mesa | $473K | 7–8% | 4–6% | 3–3.5 | Balanced resilience |
| Gilbert | $550K+ | 8% | 4–5% | 2.5 | Premium stability |
| Chandler | $500K | 6–7% | 5% | 3 | Job-tied steady |
| Queen Crk | $575K | 9%+ (volatile) | 3–5% | 4+ | Growth potential |
Navigating Risks with Confidence
Gilbert’s HOAs limit flexibility; Chandler ebbs with tech; Queen Creek wrestles water and build glut. Mesa counters with no-HOA havens (westside), senior tax relief, and organic evolution—from 2016 bargains to 2026 anchors. It weathers 6–7% rates and inventory shifts better, rewarding holds.
Fear of “cooling”? Mesa’s west value plays and east momentum prove it’s stabilization, not stall.
Mesa’s Edge for Lasting Value
Mesa holds value best by being the all-rounder: entry affordability like no other, rental muscle, and central soul that keeps demand humming. It’s not Gilbert’s shine or Queen Creek’s sprint—it’s the East Valley’s steady heart, building wealth through cycles.
If you’re thinking about making a move in the East Valley, you don’t have to figure it out alone. Let’s weigh your priorities against these cities, spotlighting where your investment thrives long-term. I’m here as your guide, ready to make it feel secure and right for you.
Get the full Phoenix Market Insights → [Market Insights]


-

Signs Your Phoenix Roof Needs Inspection or Repair
-
How Long Tile Roofs and Roof Underlayment Last in Phoenix
-

How Smart Thermostats Improve Cooling Efficiency in Arizona Homes
-

Why AC Systems Struggle During Extreme Phoenix Heat Waves
-
How Long Air Conditioning Units Last in Phoenix Homes
-

Warning Signs Your Air Conditioner Is About to Fail
-

How Often Phoenix AC Systems Need Maintenance
-
How Irrigation System Leaks Damage Foundations and Landscaping
-

Preventing Roof Damage Before Arizona Monsoon Storms
-

Why AC Tune-Ups Are Critical for Phoenix Homes
-

What Homeowners Should Inspect Before Phoenix Summer Heat Arrives
-

Seasonal Home Maintenance Checklist for Phoenix Homeowners
-
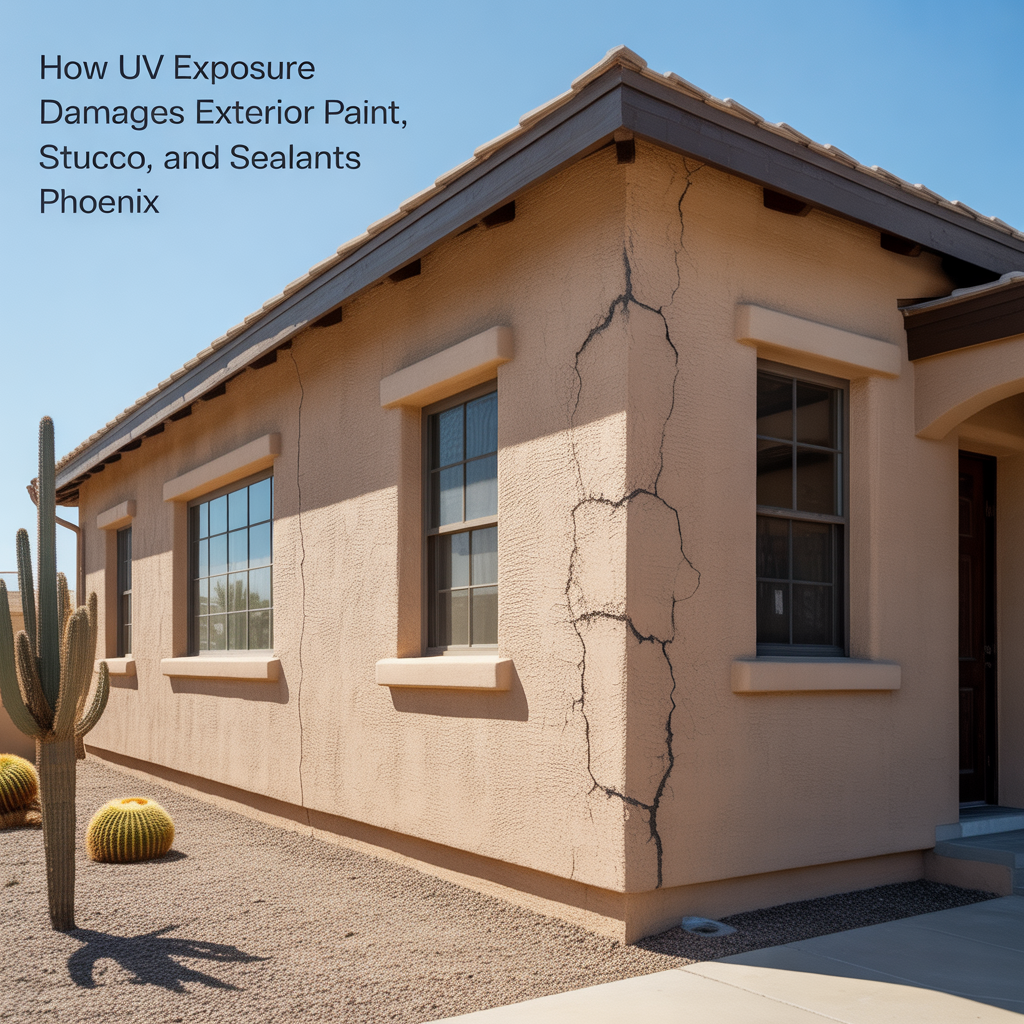
How UV Exposure Damages Exterior Paint, Stucco, and Sealants
-

How Extreme Heat Shortens the Lifespan of Home Systems
-

Why Phoenix Roofs Wear Out Faster Than Many Other Cities
-
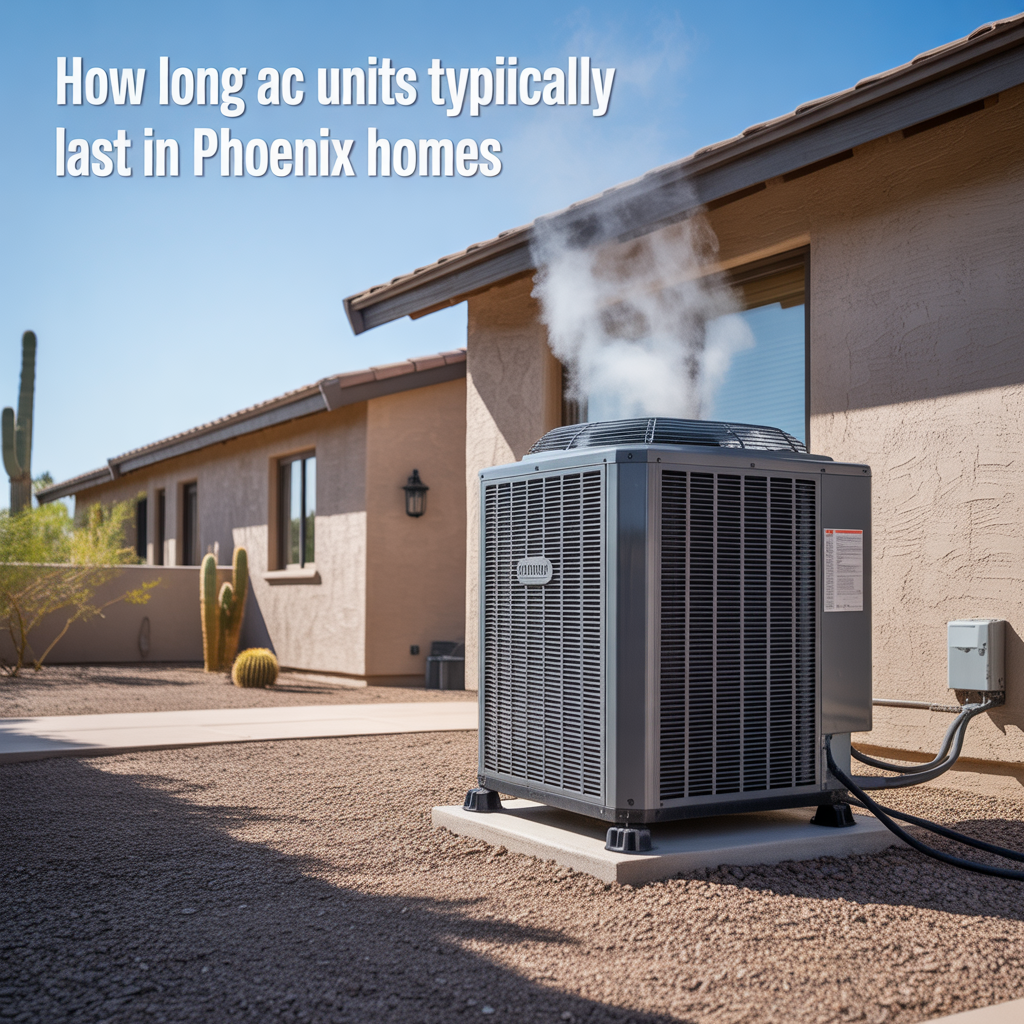
How Long AC Units Typically Last in Phoenix Homes
-

Building a Long-Term Protection Strategy
-
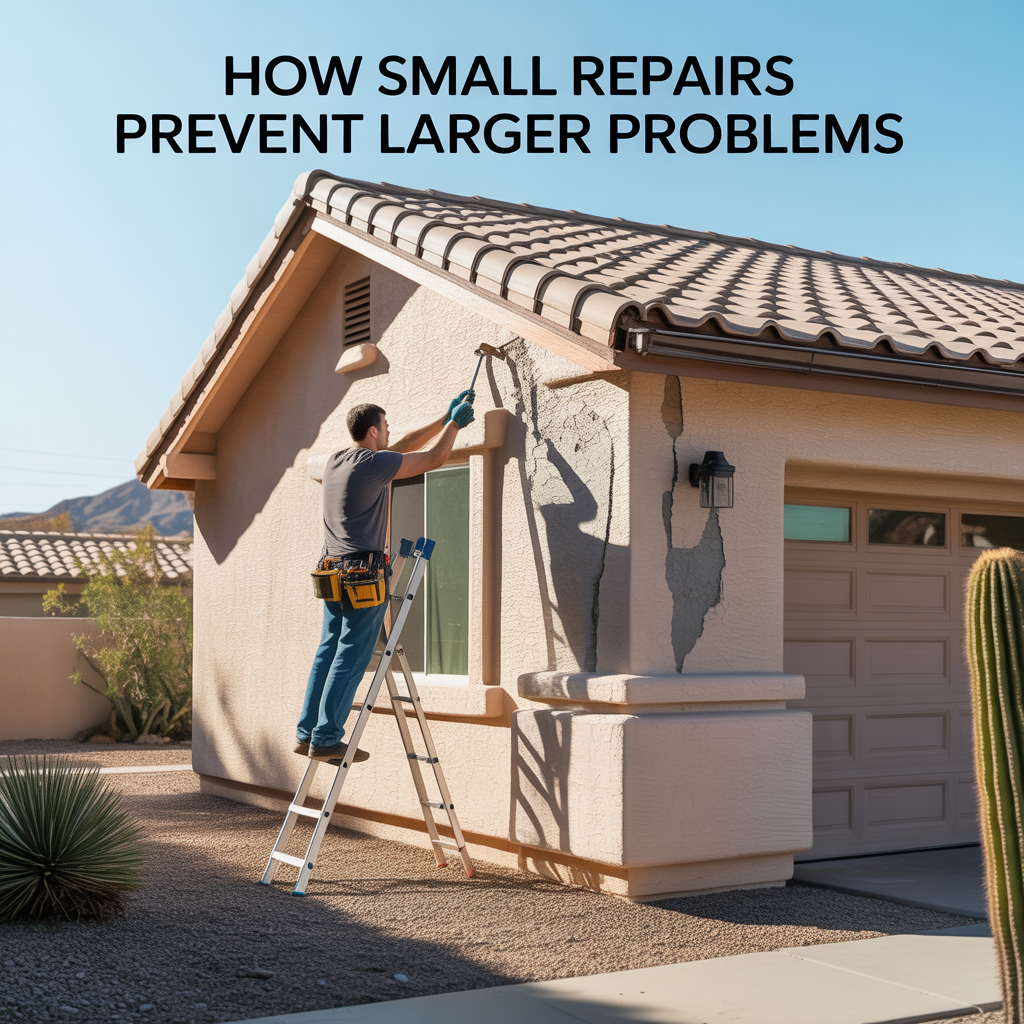
How Small Repairs Prevent Larger Problems
-

Protecting Older Phoenix Homes
-

Warning Signs of Hidden Home Risks
-

Preventative Maintenance That Reduces Insurance Claims
-

Reducing Liability Exposure Around Your Property
-

Liability Coverage Limits Explained
-

When Umbrella Insurance Makes Sense
-

Protecting Yourself From Guest Injury Claims