



Phoenix Lifestyle Guide → [Phoenix Lifestyle Guide] & For more info on Phoenix Real Estate → [Phoenix Real Estate Guide]
Written by: Renee Burke
Phoenix heat is something we all learn to navigate here, but what many newcomers don’t realize is how much microclimates within our Valley can soften—or intensify—that summer reality for your daily life. These subtle differences in temperature, shade, and airflow across neighborhoods mean one block can feel noticeably more comfortable than the next, influencing everything from energy bills to how much time you spend outdoors.
Understanding Phoenix’s Heat Baseline
Our climate delivers about 111 days a year above 100°F, with summer highs routinely hitting 110°F or more and nighttime lows often staying above 80°F due to the urban heat island effect—where pavement and buildings trap warmth long after sunset. That’s the broad picture from Sky Harbor readings, but the real story unfolds block by block, where elevation shifts, tree cover, and open spaces create pockets of relief.
Living in Phoenix means embracing this variability. It’s why some families thrive in shaded, breezy north suburbs while others layer up on AC in central asphalt-heavy zones.
Urban Heat Island: The Core Challenge
Phoenix’s downtown and central corridors—like areas around I-10 and Sky Harbor—hold heat longest, often 5-10°F warmer at night than outlying spots, thanks to concrete expanses radiating stored solar energy. Neighborhoods such as Encanto or Garfield feel this most, where older homes with less permeable yards amplify the effect, pushing AC costs higher and outdoor evenings indoors.
Contrast that with leafier enclaves like Palmcroft or Wiltshire, where mature trees and grass create cooling shade, dropping perceived temps by 4-7°F during peak afternoons. These microclimates aren’t accidents—they’re shaped by decades of planting and paving decisions.
North Phoenix and Scottsdale: Elevation Edge
Head north, and subtle elevation gains—up to 1,500 feet in areas like Piestewa Peak or DC Ranch—bring 3-5°F cooler averages, plus better evening breezes funneling down from higher desert. Trails in the Phoenix Mountain Preserve or McDowell Sonoran stay shaded longer, making them havens when central Valley bakes.
Desert Ridge or Tatum Hills homes benefit from planned open spaces and golf courses acting as natural evaporative coolers, while Cave Creek edges even further with rural airflow. Buyers here often notice lower utility bills and more livable patios, a quiet perk for year-round outdoor living.
East Valley: Canal and Foothill Relief
East Valley microclimates vary dramatically—Mesa’s flat Superstition Springs traps heat like asphalt ovens, but foothill-adjacent spots like Las Sendas or Usery Pass gain shade and wind, cooling 2-4°F via mountain shadows. Gilbert’s Agritopia leverages farm plots and canals for humidity-buffered air, mimicking a 5°F drop on humid monsoon days.
Chandler’s OCOTILLO community uses lakes and golf greens to create oasis-like zones, where mist from water features lowers yard temps noticeably. These engineered pockets make East Valley homes feel more forgiving, especially for families with kids playing outside.
South and West Valley: Open Space Buffers
South Phoenix near South Mountain enjoys afternoon shade from the massif itself, trimming highs by 2-3°F and offering cooler evenings as heat drains westward. Ahwatukee’s elevated bowl funnels breezes, keeping it milder than Tempe lowlands nearby.
West Valley—Peoria to Buckeye—relies on raw space: agriculture remnants and desert washes allow heat to dissipate, often 3°F cooler than central at night. Vistancia master-planned hills add wind corridors, while flat Goodyear zones bake harder without them. Sparse development here means more sky exposure but truer desert cooling post-sunset.
Home Features That Shape Your Microclimate
Your property itself crafts the most personal microclimate. South- and west-facing yards bake under full sun, while north and east sides stay milder for gardening or play. Bare rock mulch radiates heat; organic wood mulch insulates, cooling soil by 10-20°F. Pools, misters, or fountains raise humidity to shave 5°F off felt air temperature.
Shade trees like mesquite or palo verde drop ambient temps 10°F in their canopy, block wind, and trap moisture—essentials I point out during home tours. Concrete driveways? They’re heat amplifiers; permeable pavers or gravel breathe easier.
Health, Costs, and Lifestyle Impacts
Microclimates affect more than comfort—central heat islands link to higher heat-related health risks, while greener pockets correlate with lower stress and energy use. Homes in shaded, breezy zones save 15-25% on cooling bills, and resale favors them in our market. Families notice kids playing longer outside; retirees value walkable mildness.
Monsoons add twist—muggier east foothill spots feel stickier, but they green up beautifully, offsetting dry-season intensity.
Steps to Assess and Improve Your Spot
Finding your microclimate match starts simply:
- Track temps in potential yards at noon, 4 p.m., and 10 p.m. using cheap thermometers.
- Note shade patterns—south walls scorch; east patios ease into day.
- Feel airflow—hills and washes breathe better than cul-de-sac traps.
- Audit hardscape: swap rocks for mulch, add vines on walls.
Plant strategically—evergreens north for winter warmth, deciduous south for summer shade. These tweaks turn challenging lots into sanctuaries.
A Warm Invitation
If you’re thinking about making a move in Phoenix, you don’t have to figure it out alone. Whether it’s scouting cooler north foothill homes or tweaking a central yard for comfort, I’m here to guide you through the spots that make our heat manageable and our living joyful.
Reach out anytime—I’d love to walk a few neighborhoods with you and find the microclimate that feels just right.
Get the full Phoenix Market Insights → [Market Insights]


-

Separating Lifestyle Spending From Homeownership Costs
-
How Usage Changes Monthly Ownership Costs
-
Planning Around Utility Cost Volatility
-

Why Variable Expenses Drive Most Budget Stress
-

Fixed Costs That Aren’t Actually Fixed
-
Budgeting for the House You’ll Own in Five Years
-

Why Ownership Cash Flow Feels Tighter Over Time
-
How Escrow Masks Long-Term Cost Growth
-

Why Your Mortgage Payment Isn’t Your True Housing Cost
-

Cross-Valley Trips: When They Feel Easy vs Heavy
-

Remote-Work Friendly Pockets in Glendale
-

School-Run Congestion Zones and Timing
-

Arterial Routing and “Daily Loop” Efficiency
-

State Farm Stadium and it’s Effect on Life and Property Value
-

Freeway Access as a Lifestyle Multiplier in Glendale
-

Event-Night Traffic Impacts and Avoidance Strategies
-

Weekday Commute Direction Tradeoffs From Glendale
-
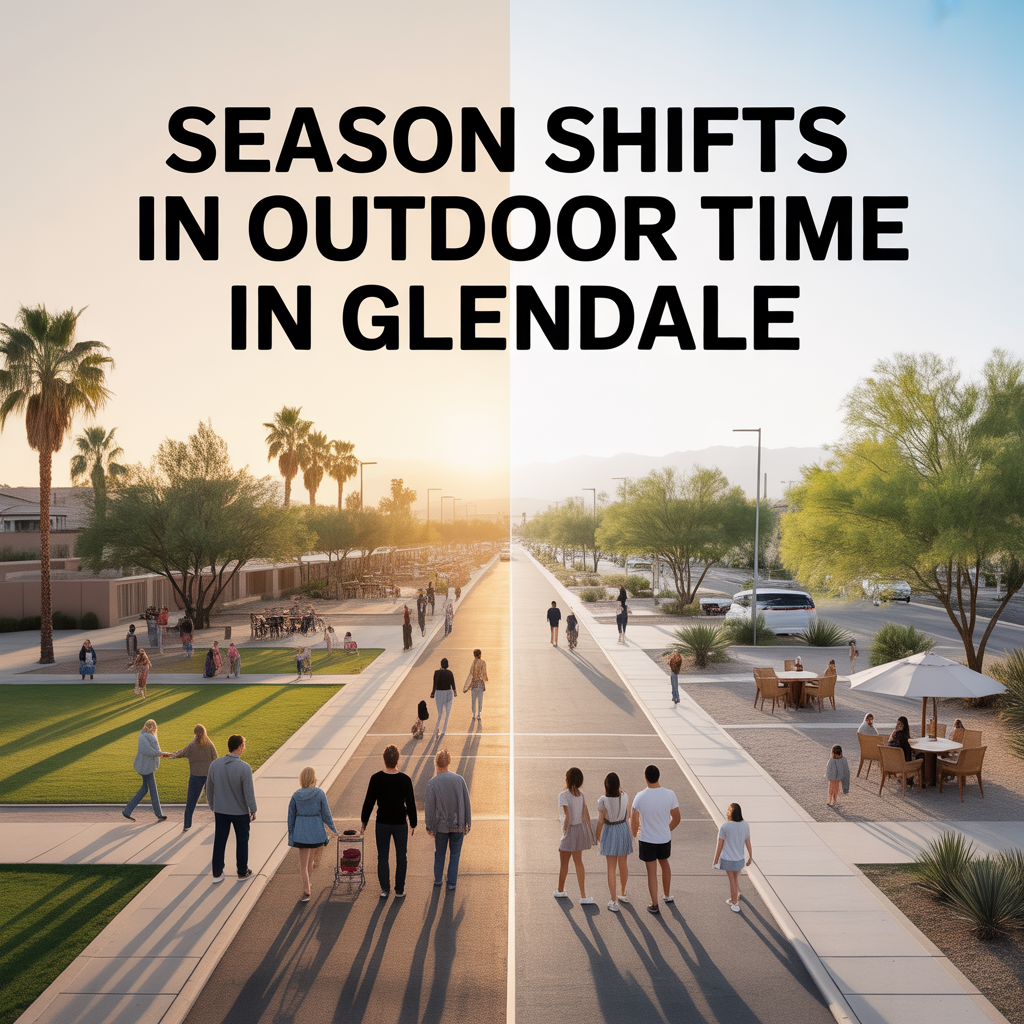
Season Shifts in Outdoor Time in Glendale
-
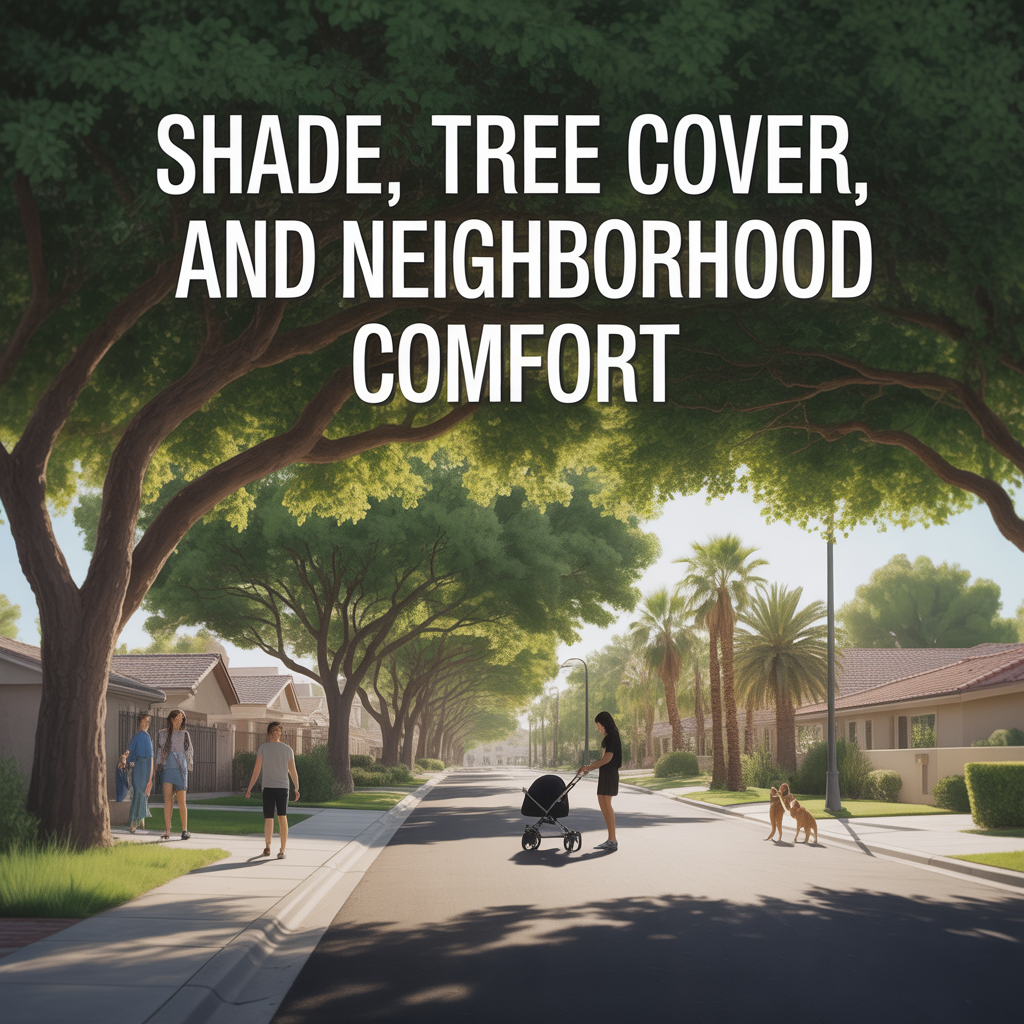
Shade, Tree Cover, and Neighborhood Comfort
-

Dog and Kid Friendly Outdoor Routines
-

Trail Access That Feels Routine-Friendly
-

Sports Parks and Family Recreation Patterns
-

Map Proximity vs Summer Usability in Glendale
-
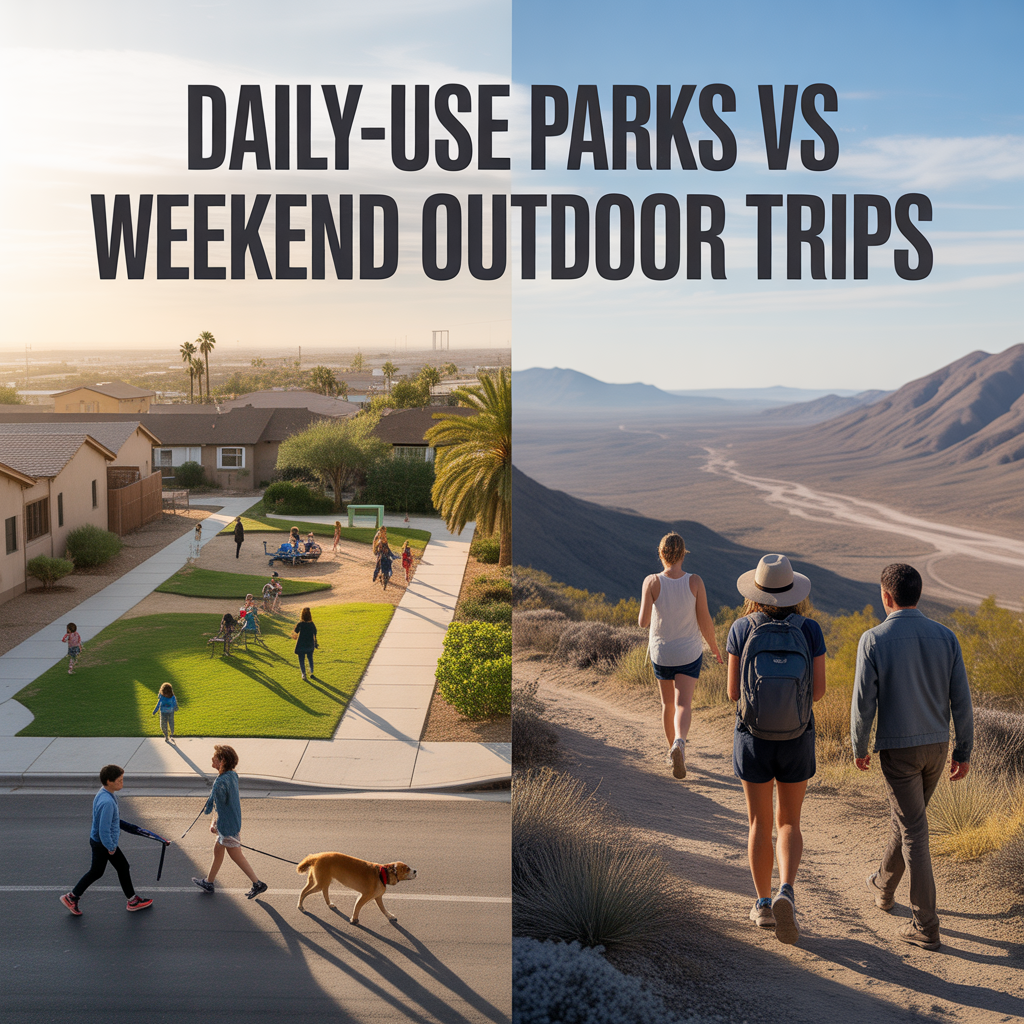
Daily-Use Parks vs Weekend Outdoor Trips
-

Top 10 “Date Night Out” Spots in Glendale