


Phoenix Lifestyle Guide → [Phoenix Lifestyle Guide] & For more info on Phoenix Real Estate → [Phoenix Real Estate Guide]
Written by: Renee Burke
Chandler’s real estate market reflects its family-friendly charm and steady growth in early 2026—a balanced environment where buyers find breathing room amid rising inventory, and sellers capitalize on strong local demand from jobs and schools. We’ve transitioned from overheated competition to a more predictable pace that favors preparation over panic.
Current Market Snapshot
February shows a median sold price around $523,000–$524,000, down slightly 7.4% year-over-year but up 1.7% month-over-month, with price per square foot steady at $287. Active listings number 613–634, providing 2.71 months of supply—a neutral balance leaning slightly toward buyers in some segments.
Homes average 42–84 days on market (up from tighter timelines), with 229 sales closing in December at $136 million volume and a 97.99% list-to-sale ratio—most sell near ask when priced right. Somewhat competitive (Redfin score 54/100), with 2 offers typical on well-positioned properties. Rentals median $2,675, absorbing fast at 17 days on market.
Driving Forces
Chandler draws families and professionals with Intel expansion, top-rated Chandler Unified schools, and master-planned appeal in Ocotillo or Fulton Ranch. In-migration from California and Midwest sustains demand, though lock-in effect (sub-5% rates) limits resale supply. New listings rose (median $550,000, up 5.8%), signaling seller confidence amid low-6% rates and concessions in 50%+ of sub-$600k deals.
Mid-range ($500k–$1M) holds 31.8% market share; high-end grows volume. Demand ticks up year-over-year (more pendings, UCB/CCBS), but supply growth tempers frenzy.
Buyer Advantages
Ample choices mean negotiation power—expect 2–4% off list, credits, or buydowns under $600k. Focus on single-family in family pockets like South Chandler; 62-day average sales pace rewards decisive offers on shaded, pool-ready homes. Pending medians at $545,900 signal momentum for prepared buyers.
Seller Strategies
Price near medians ($534k–$550k active) to avoid cuts—overpriced linger at 70+ days. Stage for lifestyle: highlight low-maintenance yards, proximity to parks/A101, energy-efficient features. Spring snowbird wave builds; use pro photos now. Detached outperform townhomes; fast rentals boost investor appeal.
Neighborhood Highlights
Looking Forward
Balanced outlook: 3–5% appreciation, stable inventory, job-driven demand. No crash risks—spring peaks with seasonal influx; watch rates for shifts. Chandler remains a smart long-term hold.
If you’re thinking about making a move in the Chandler area, you don’t have to figure it out alone. I’m here with insider knowledge to guide you through this steady market—finding family havens or pricing for peak performance. Reach out anytime; we’ll plan thoughtfully for your best next step.
Get the full Phoenix Market Insights → [Market Insights]

-
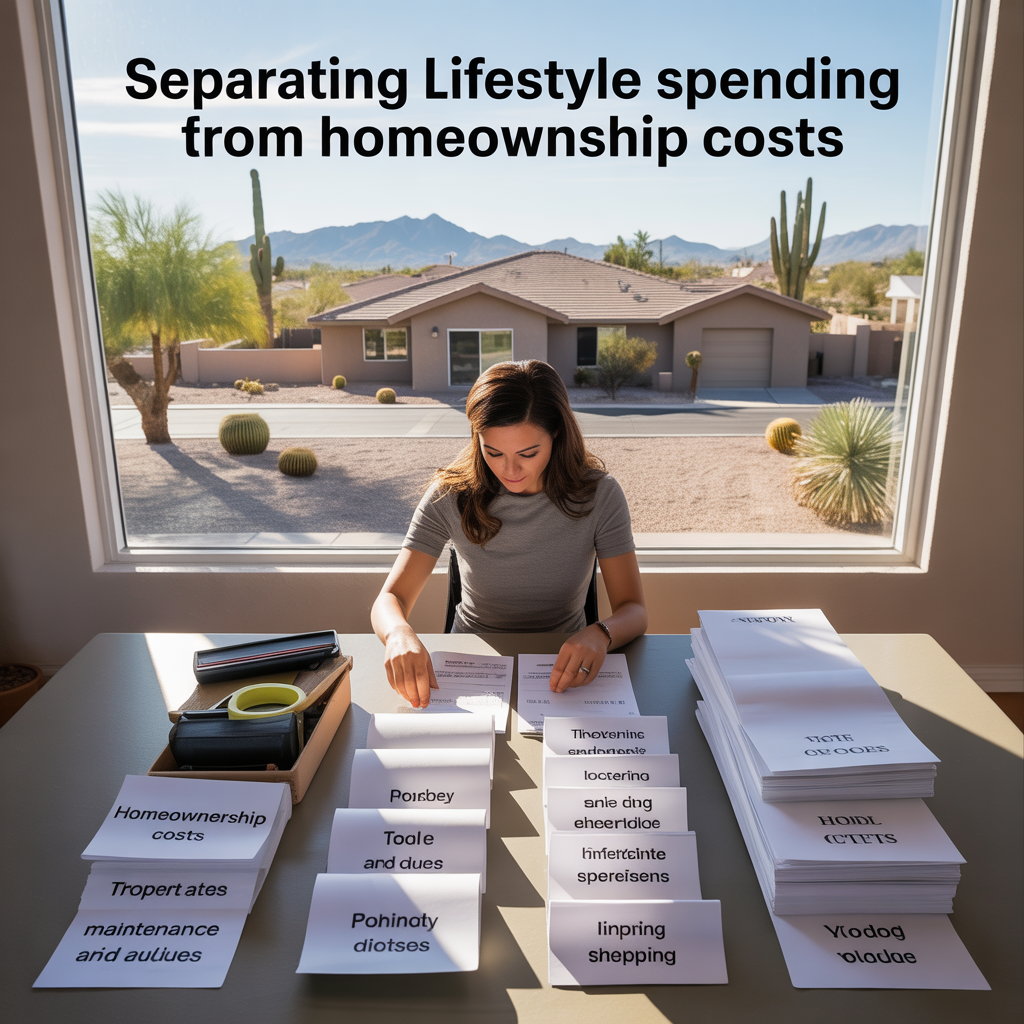
Separating Lifestyle Spending From Homeownership Costs
-
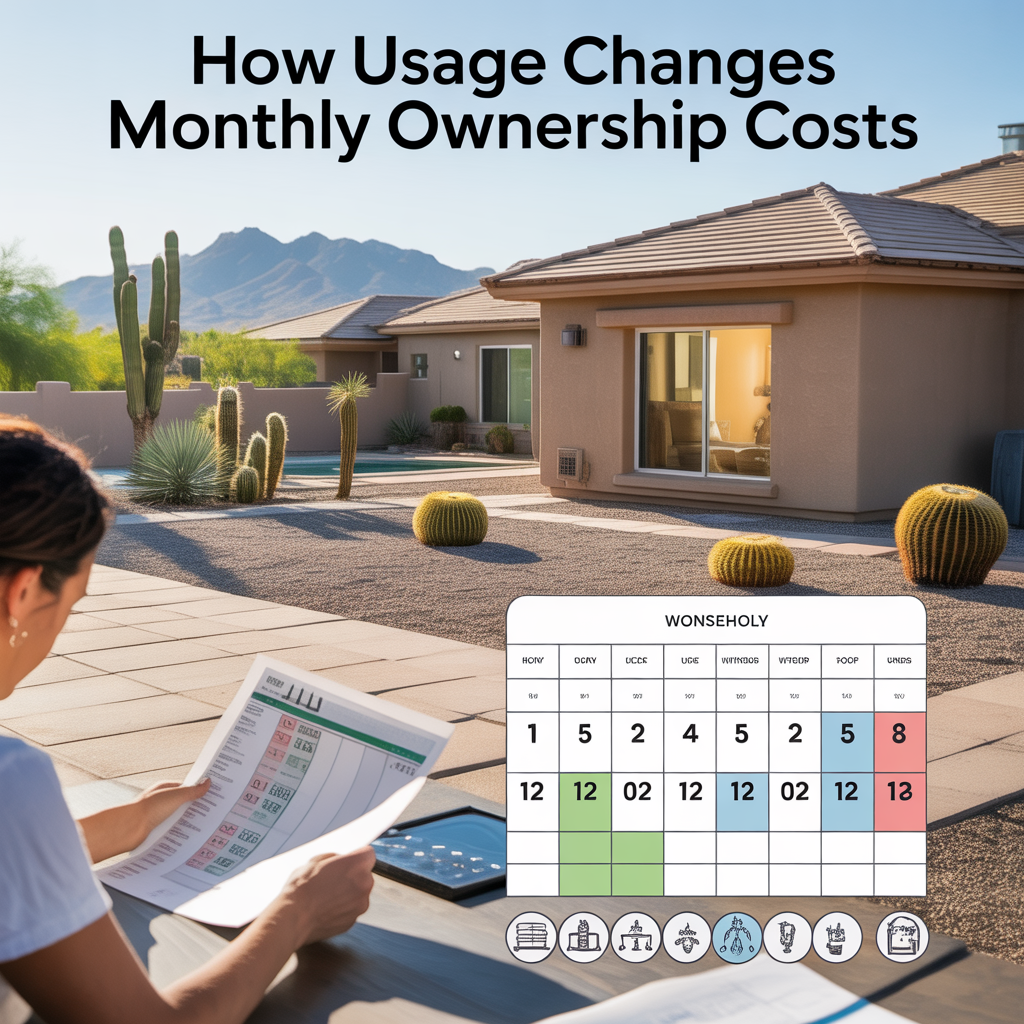
How Usage Changes Monthly Ownership Costs
-
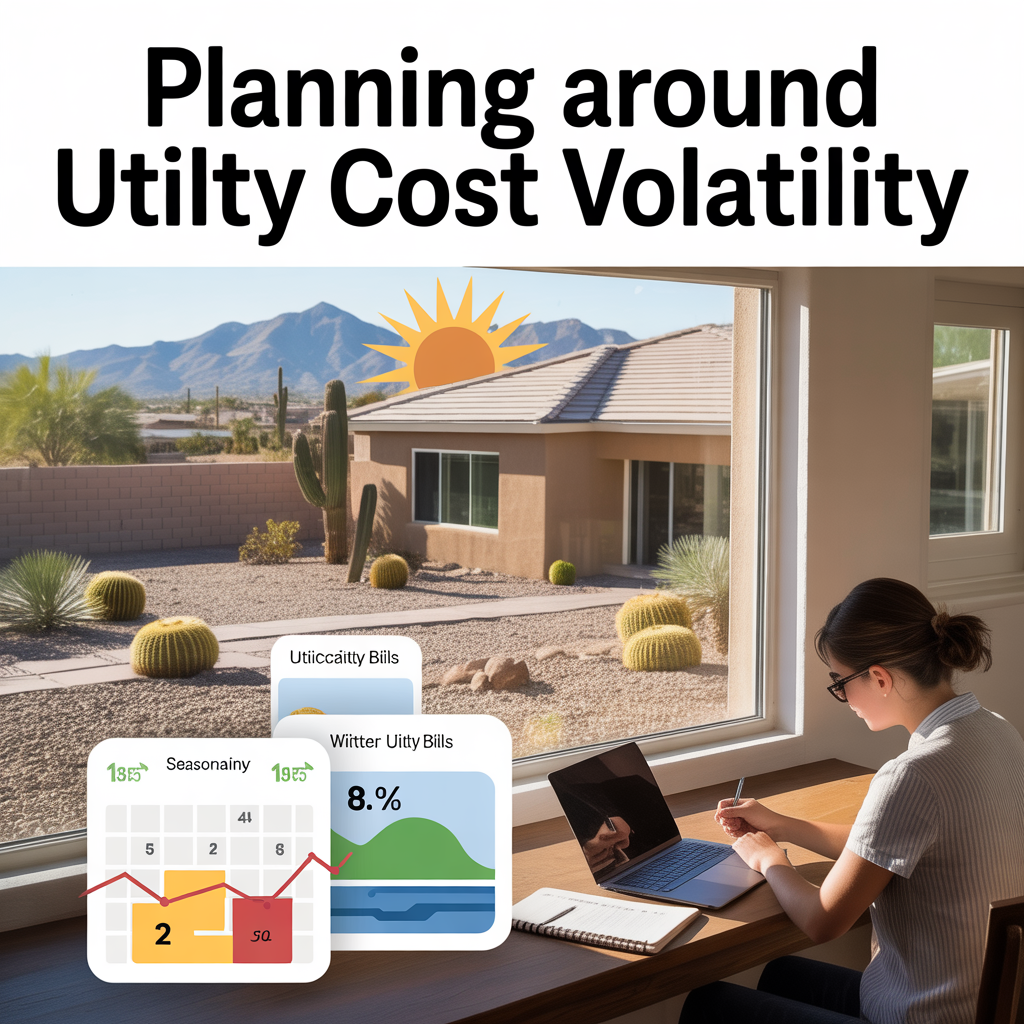
Planning Around Utility Cost Volatility
-
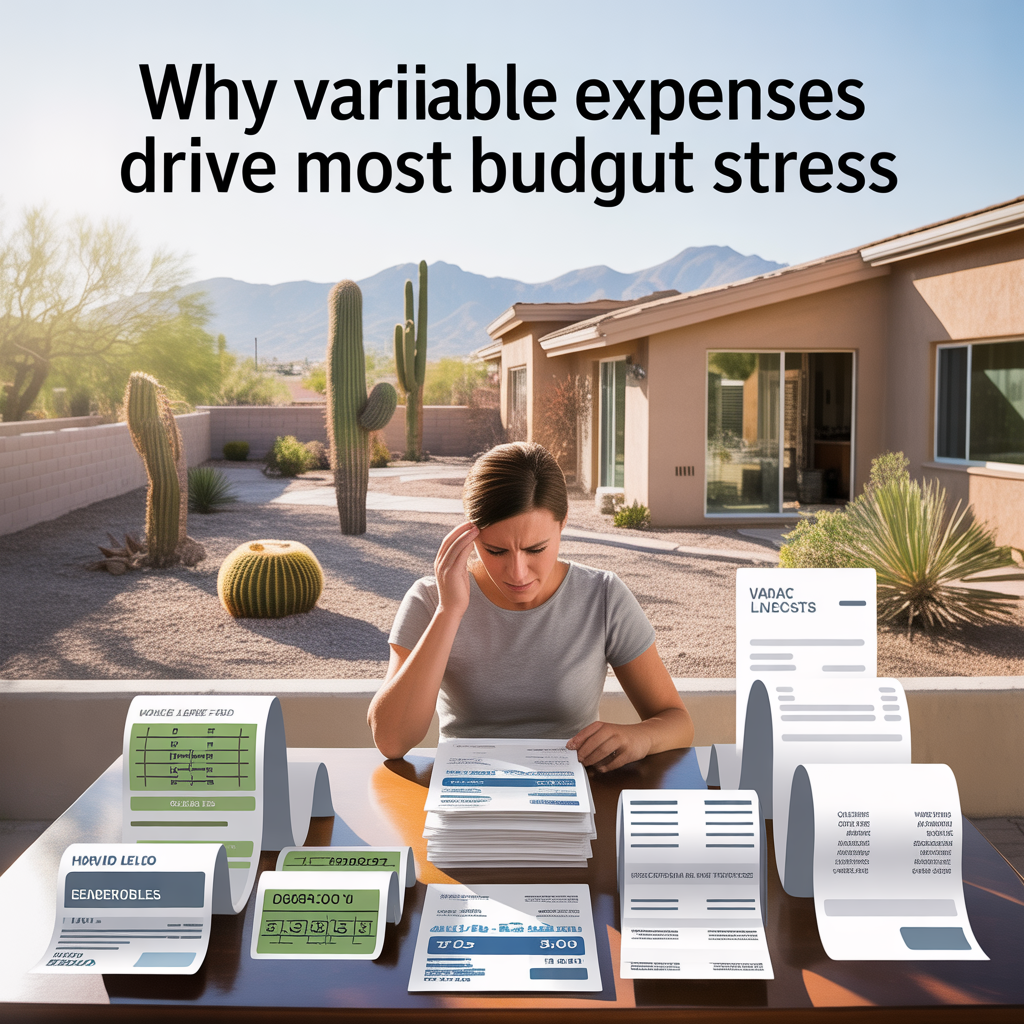
Why Variable Expenses Drive Most Budget Stress
-
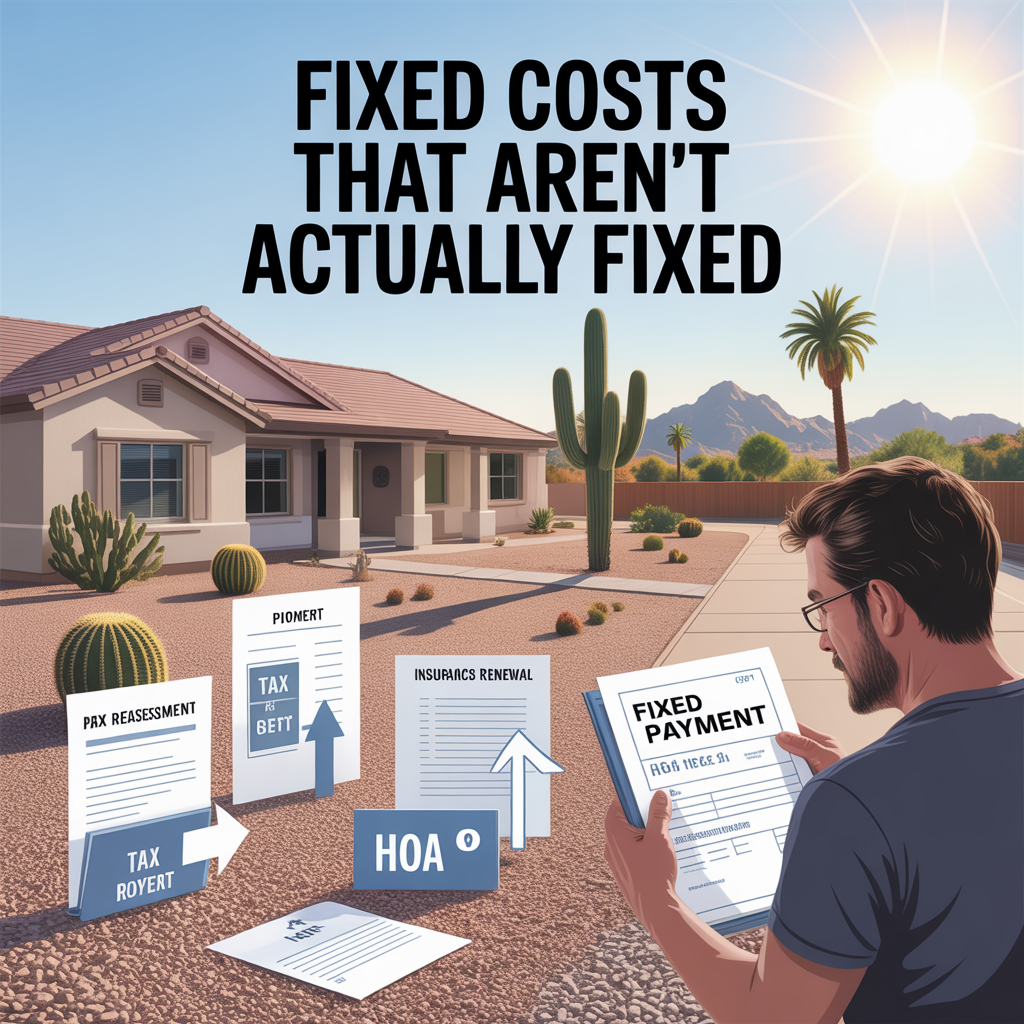
Fixed Costs That Aren’t Actually Fixed
-
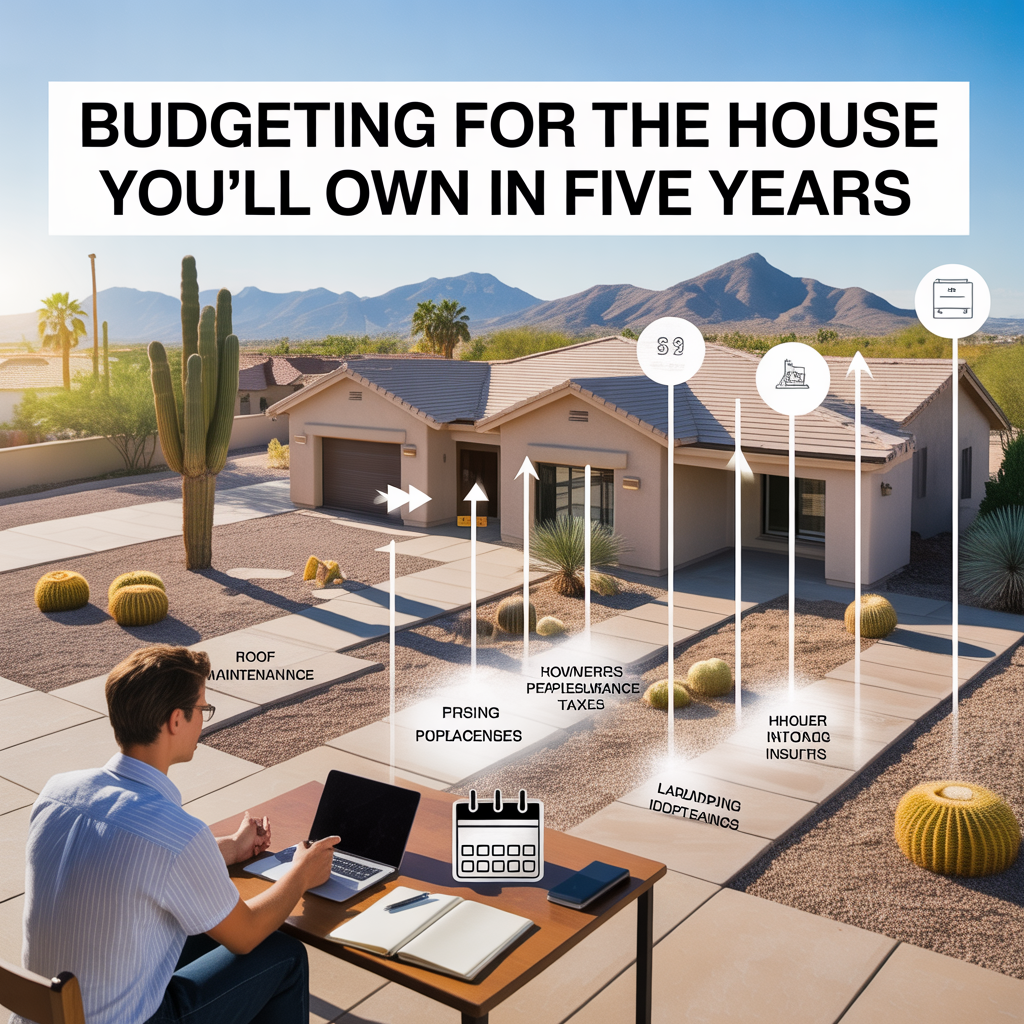
Budgeting for the House You’ll Own in Five Years
-
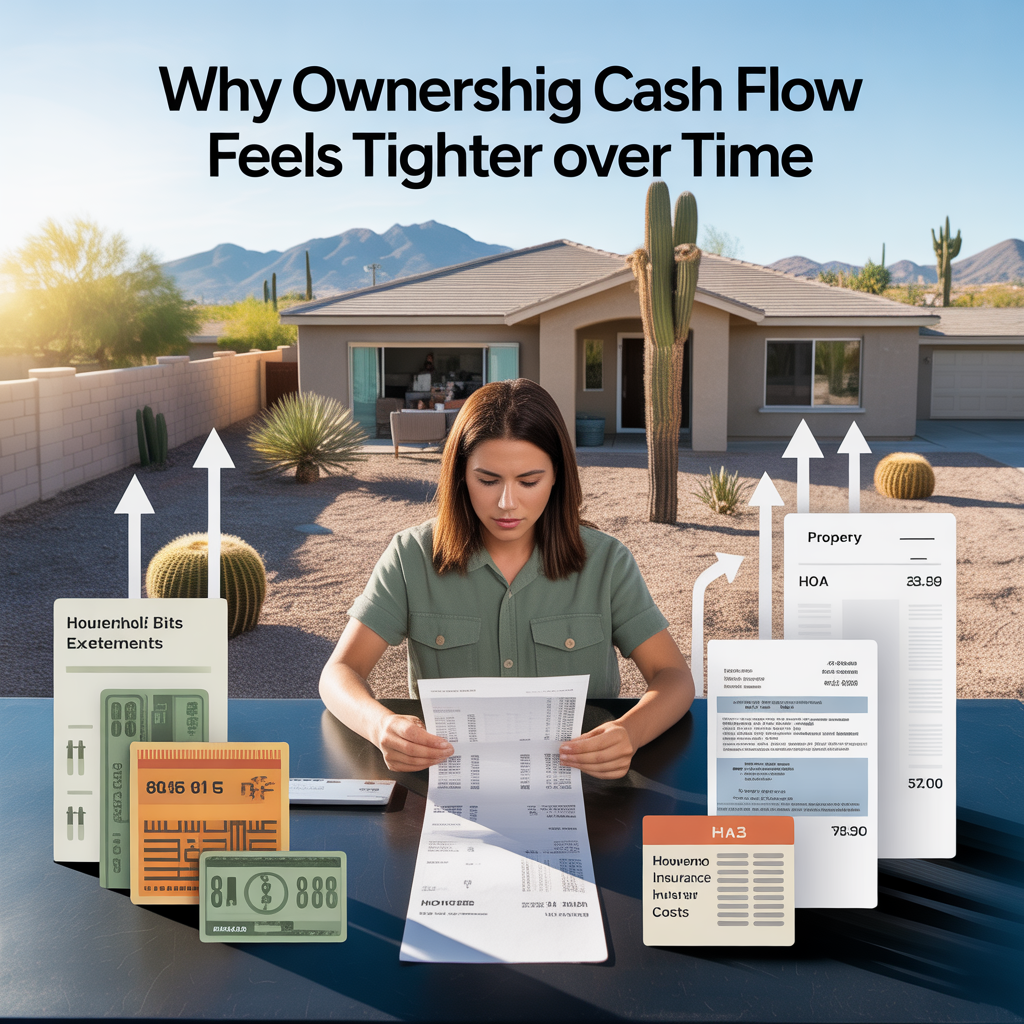
Why Ownership Cash Flow Feels Tighter Over Time
-
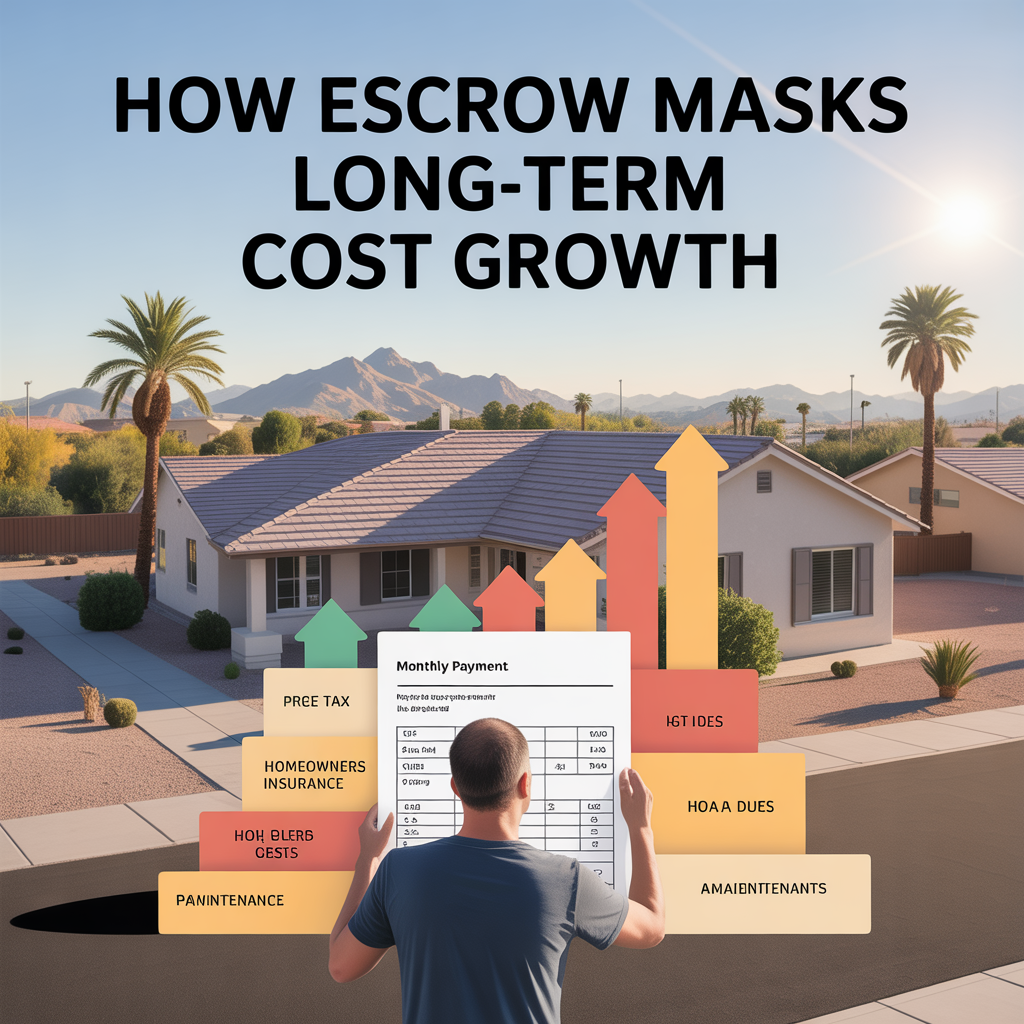
How Escrow Masks Long-Term Cost Growth
-
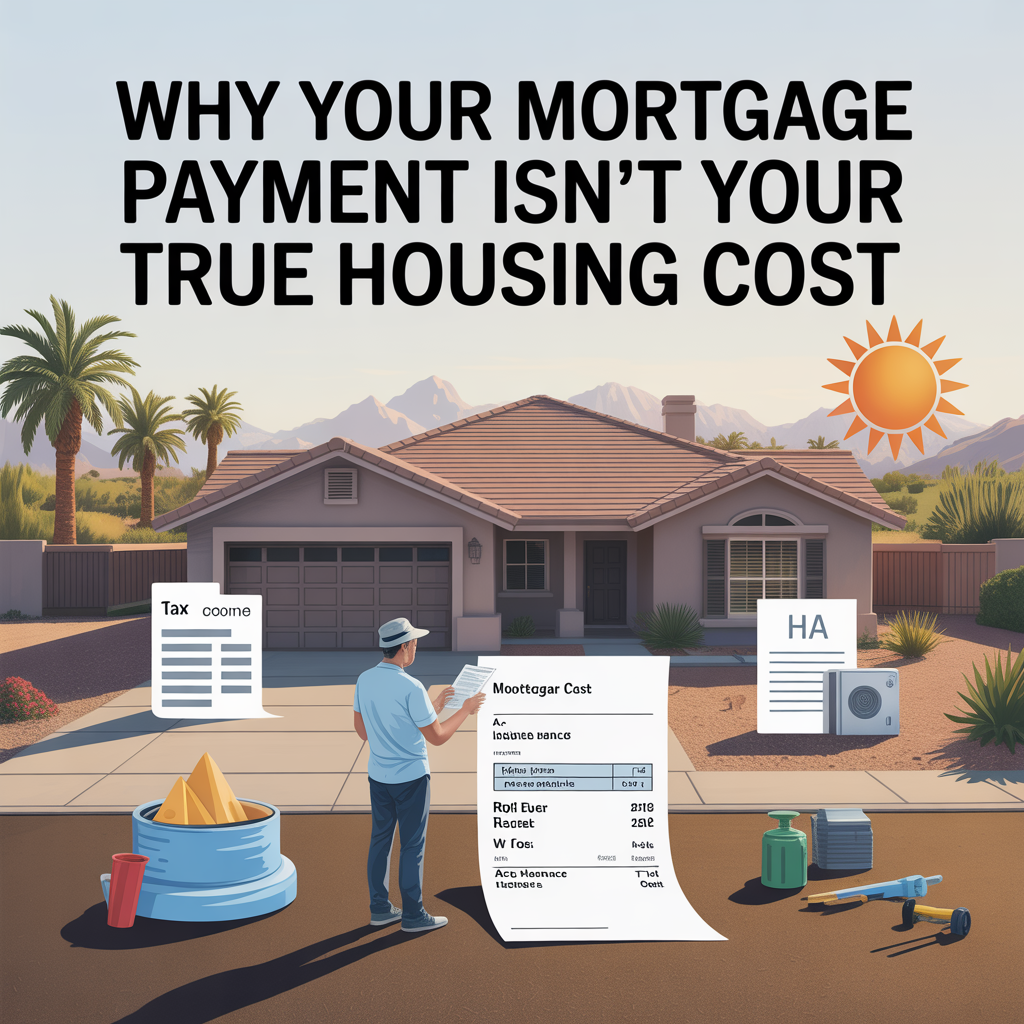
Why Your Mortgage Payment Isn’t Your True Housing Cost
-

Cross-Valley Trips: When They Feel Easy vs Heavy
-
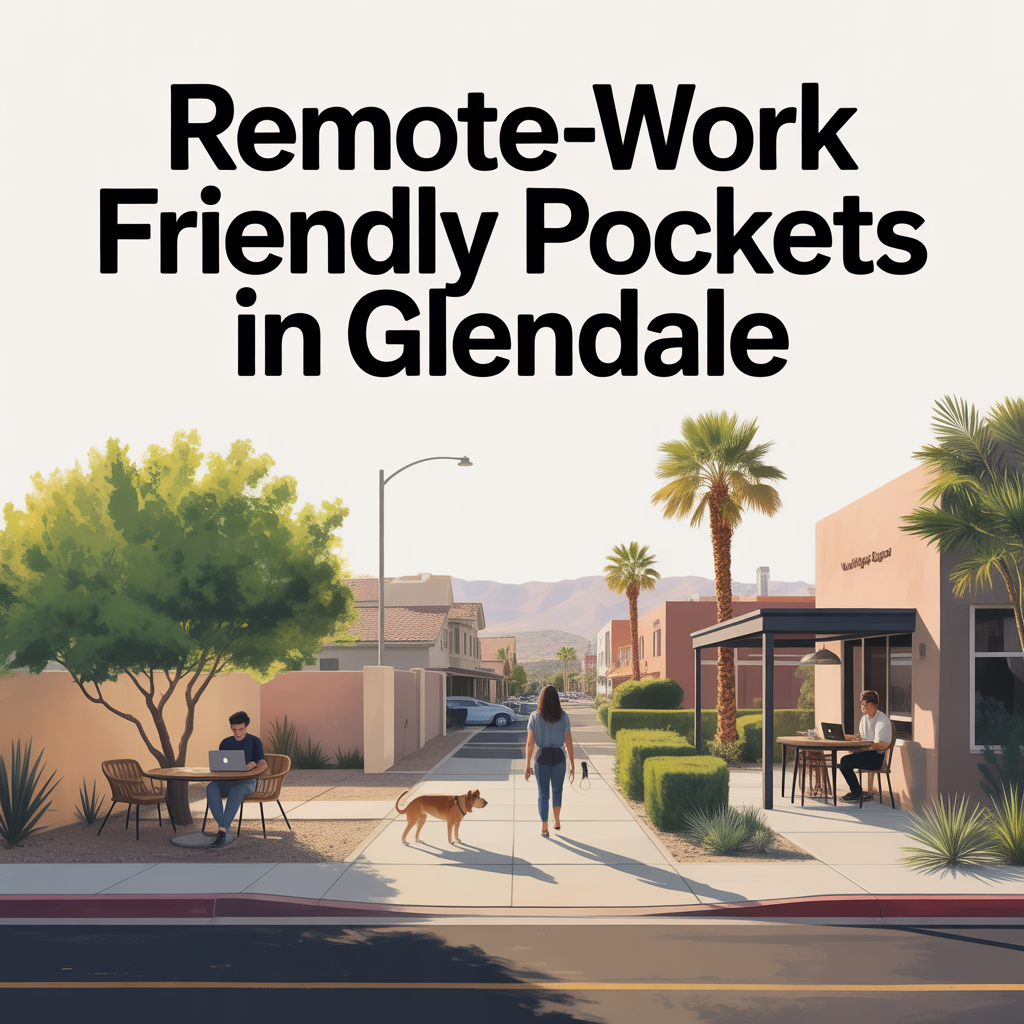
Remote-Work Friendly Pockets in Glendale
-
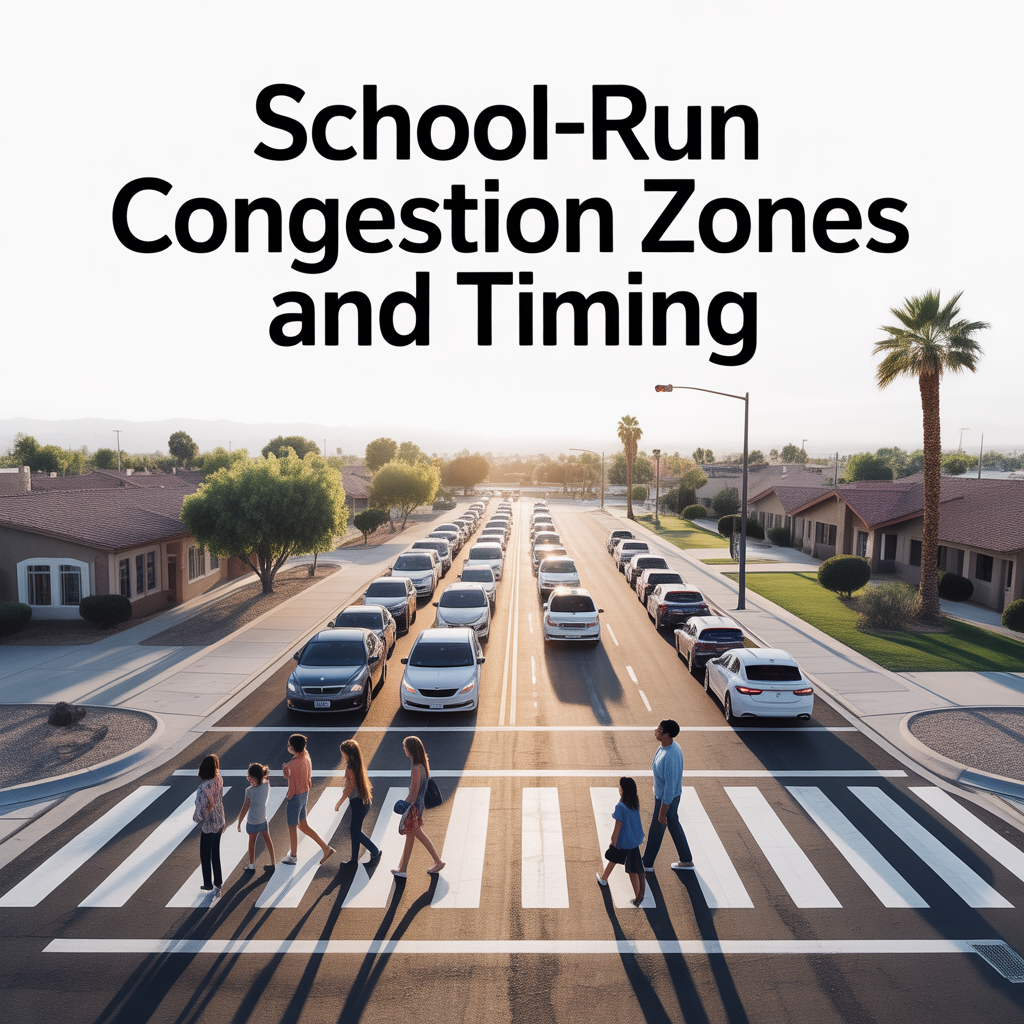
School-Run Congestion Zones and Timing
-

Arterial Routing and “Daily Loop” Efficiency
-

State Farm Stadium and it’s Effect on Life and Property Value
-
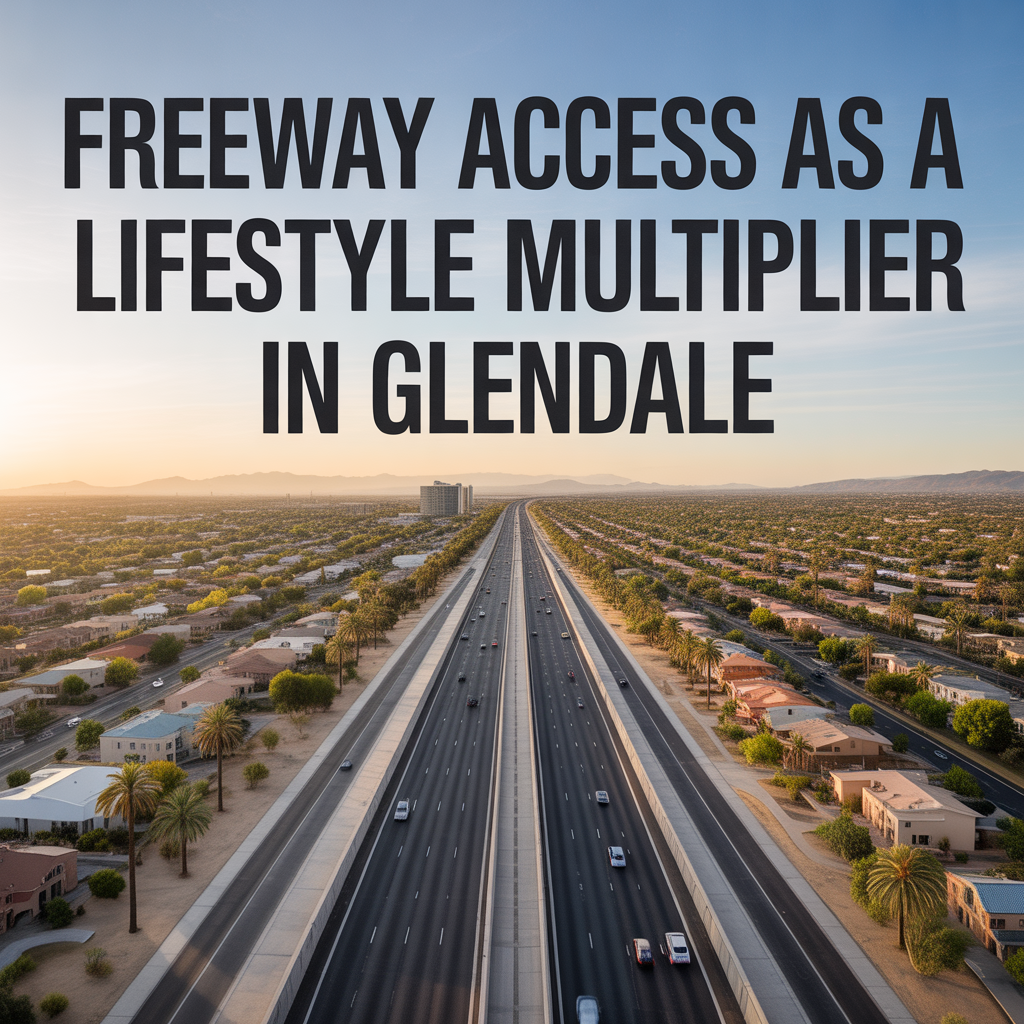
Freeway Access as a Lifestyle Multiplier in Glendale
-

Event-Night Traffic Impacts and Avoidance Strategies
-

Weekday Commute Direction Tradeoffs From Glendale
-
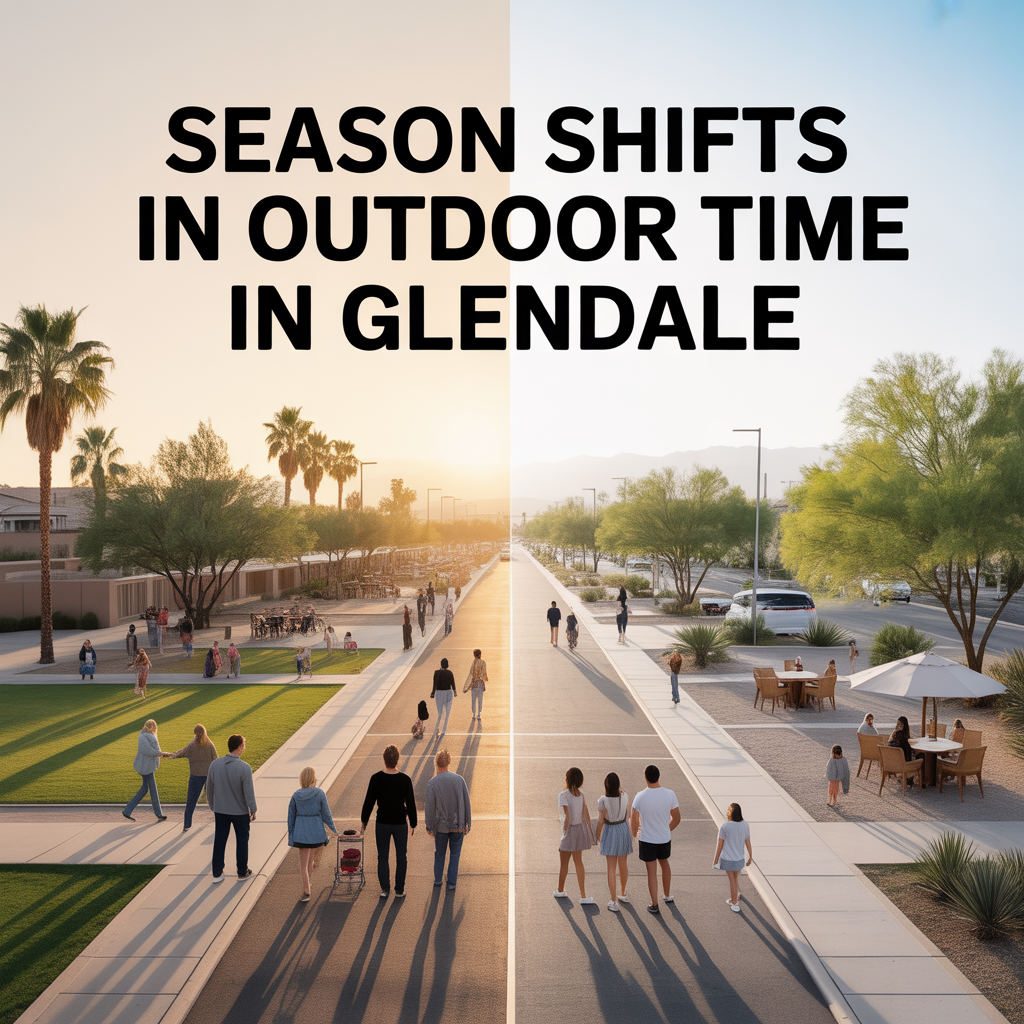
Season Shifts in Outdoor Time in Glendale
-
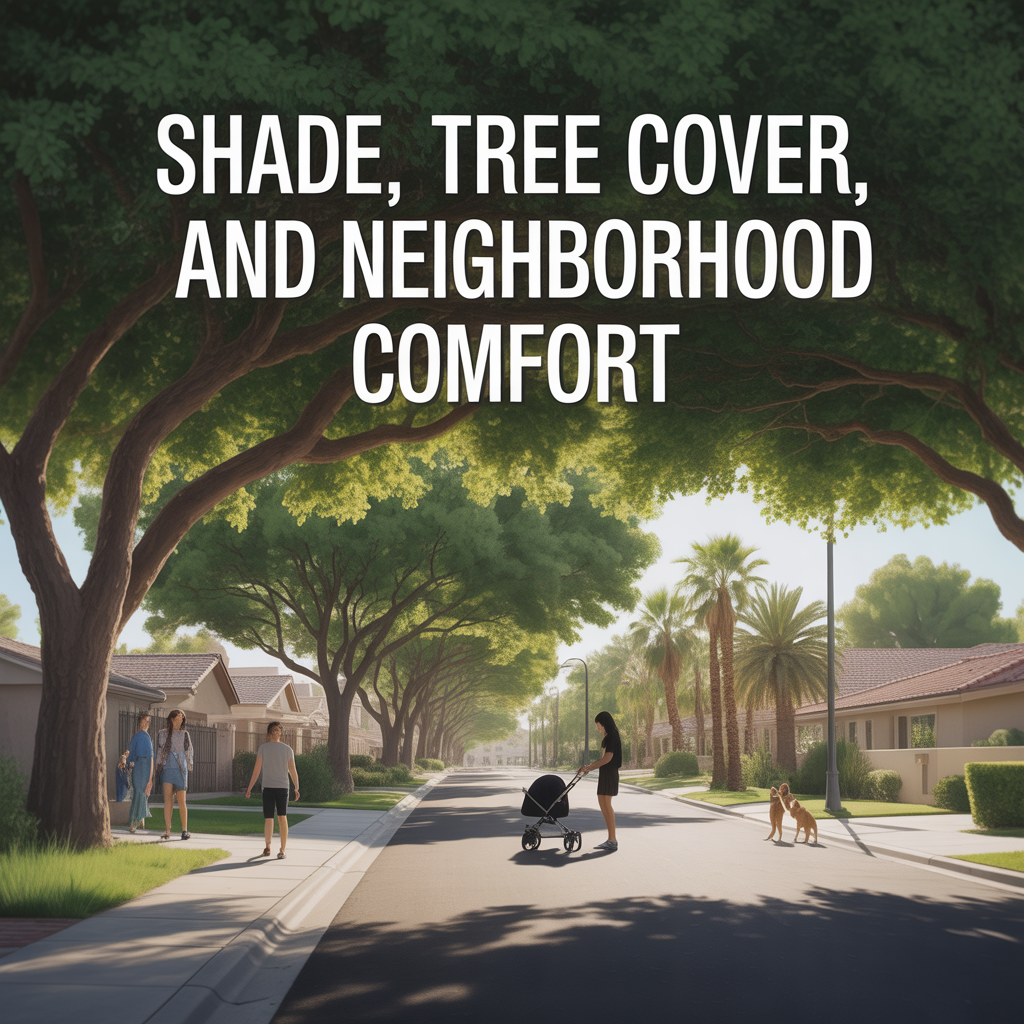
Shade, Tree Cover, and Neighborhood Comfort
-

Dog and Kid Friendly Outdoor Routines
-

Trail Access That Feels Routine-Friendly
-
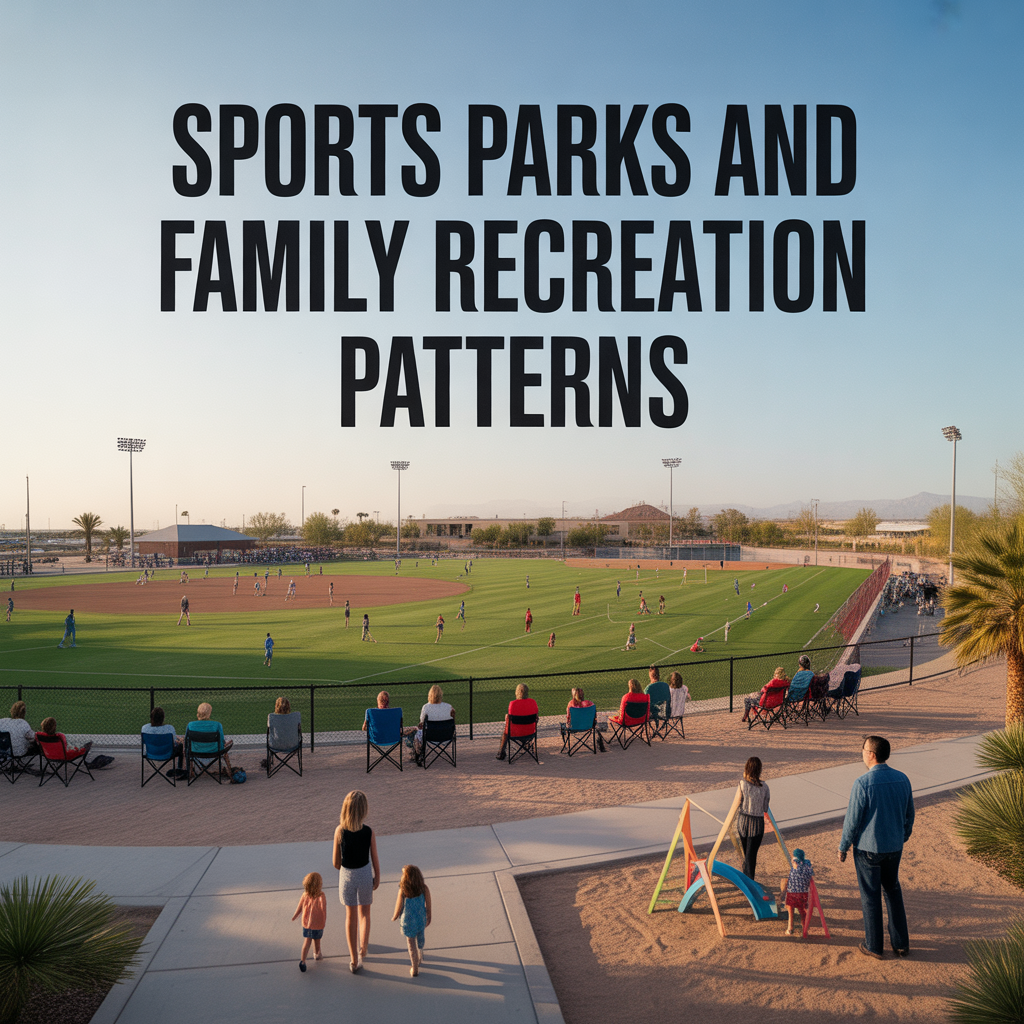
Sports Parks and Family Recreation Patterns
-
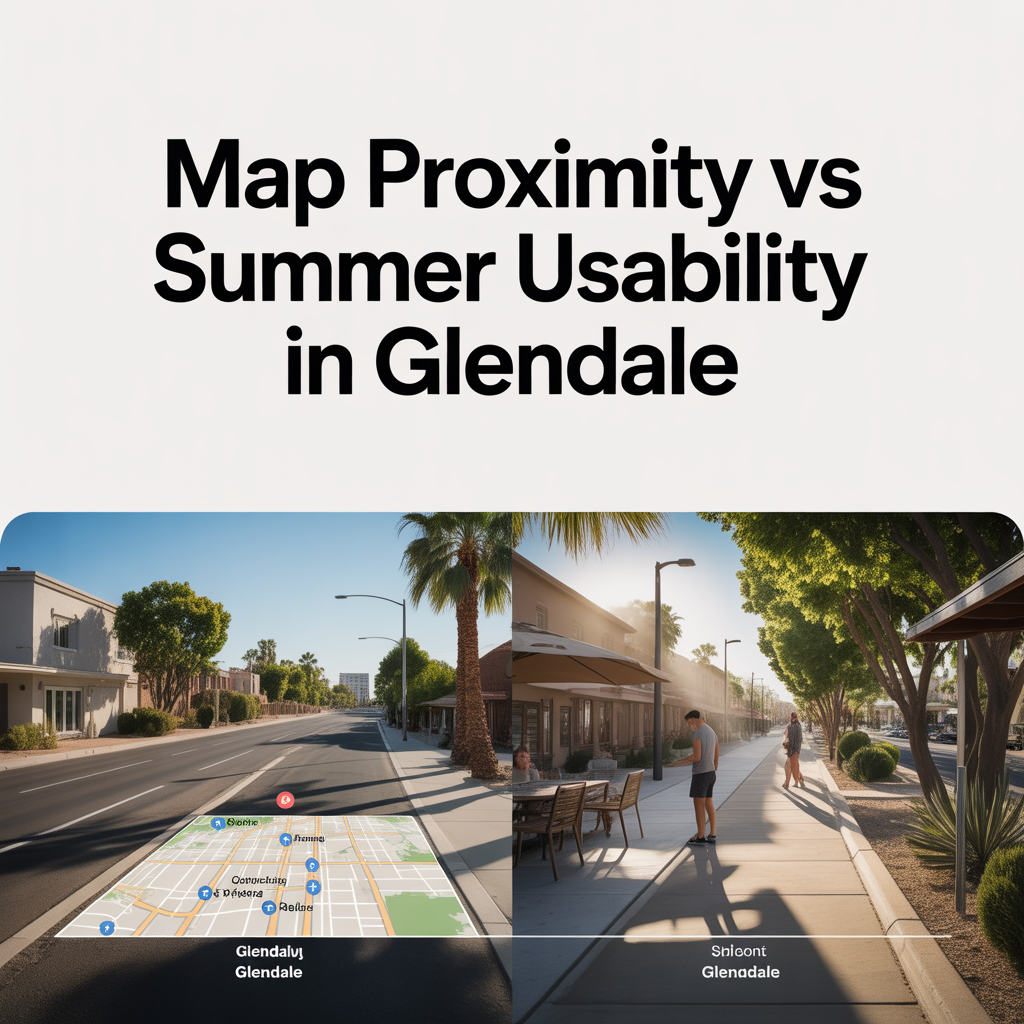
Map Proximity vs Summer Usability in Glendale
-
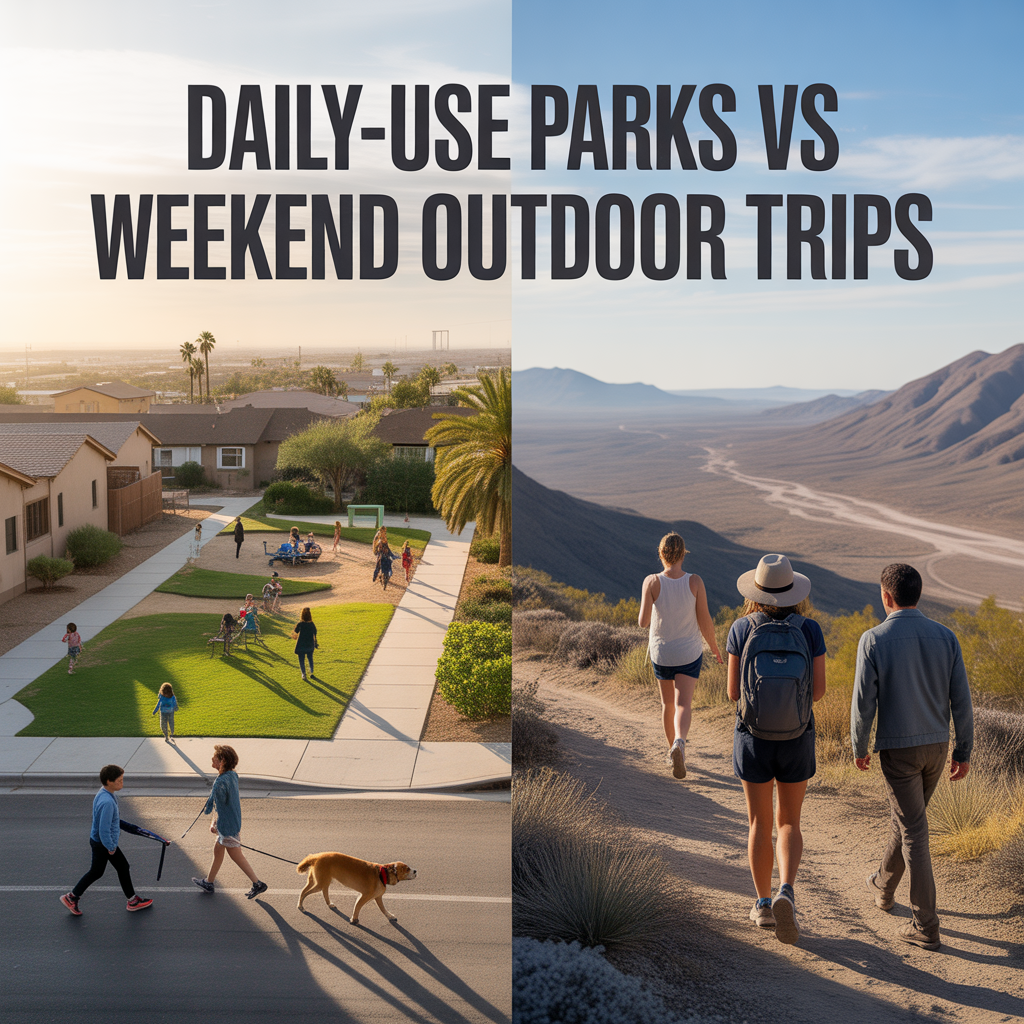
Daily-Use Parks vs Weekend Outdoor Trips
-

Top 10 “Date Night Out” Spots in Glendale