


Phoenix Lifestyle Guide → [Phoenix Lifestyle Guide] & For more info on Phoenix Real Estate → [Phoenix Real Estate Guide]
Written by: Renee Burke
Selling a home in Phoenix often comes with the question, “How long will it take?” — a perfectly natural concern when you’re picturing boxes packed and life in transition. I’ve guided sellers through this across the Valley, from the quick turns in Gilbert to the steadier pace in outer West Valley, and the answer isn’t one-size-fits-all. Right now, in early 2026, our market leans buyer-friendly with rising inventory, stretching average days on market to 60-90 days Valley-wide. But with smart pricing and prep, many homes close much faster. Let’s unpack the realities, factors, and strategies so you can set expectations with calm clarity.
Current Market Averages: The 2026 Snapshot
As of February 2026, Phoenix homes average 70-92 days on market — up from tighter 30-50 day norms of recent years. Zillow notes listings going pending around 38 days in some pockets, while broader metro data hits 78-85 days per Movoto and recent reports. Closed sales reflect January slowdowns (holiday contracts lingering), but active inventory at 24,000+ homes signals 5+ months’ supply — giving buyers time to negotiate.
This shift favors thoughtful sellers: pristine properties under $600K in growth areas like Goodyear still move in 30-45 days, while luxury or overpriced listings test 100+ days. It’s normalization after pandemic frenzy, not a crash — demand holds from relocators and locals upgrading.
What Influences Days on Market
Several Valley-specific dynamics dictate speed:
- Price Alignment: Spot-on pricing (comps-based) nets 20-40 days; 5% over list adds 30-60 days as buyers scroll MLS endlessly.
- Condition and Staging: Move-in-ready with solar, pools, and fresh neutrals sells 2x faster than dated flips needing $50K work.
- Location Nuances: Central (Arcadia, Biltmore) flies at 40-60 days; West Valley (Buckeye) lags at 80-100 due to new supply.
- Seasonal Flow: Spring listings average 25-35 days; summer stretches to 50 as heat quiets casual browsers.
- Market Metrics: 61% listing success rate means half need tweaks — rate drops or incentives shave weeks.
Buyers now shop selectively, prioritizing efficiencies like foam insulation over cosmetic flash, extending picky timelines.
Neighborhood Breakdown: Fast vs. Steady
Phoenix varies block by block — here’s how timelines shake out:
East/Central outperforms outer rings; single-stories under $700K lead speed across all.
Strategies to Sell Faster
You control more than you think — here’s how to beat averages:
- Pre-Launch Polish: Declutter, paint greige, xeriscape curb. “Coming Soon” status builds buzz without clock-starting.
- Price Aggressively: Aim sold-comps minus 2% for multiple offers; overpricing kills momentum early.
- Proactive Marketing: Drone tours at sunset, virtual staging, targeted ads to California transplants.
- Incentives Smartly: Cover A/C inspections or $5K credits — buyers bite without devaluing.
- Flex Showings: Evenings/weekends suit remote workers; pool misters for summer edge.
Clients using these close 20-40% under averages, even in 92-day winters. Pre-inspect termites/HOA estoppel for seamless escrows.
Buyer Mindset and Timeline Realities
Today’s buyers — young families, tech relos, downsizers — take 2-3 weeks browsing before offers, wary of rates (mid-6s) and insurance hikes. Pended homes close 30-45 days post-contract, totaling 60-90 from list. Cash (20% of sales) shaves 15 days; FHA/VA add scrutiny.
Patience pays: 73-day national average mirrors our softening; Phoenix’s sun keeps us ahead of Midwest chills.
When Speed Isn’t Everything
Longer timelines aren’t failure — they build negotiation room. A 90-day sale at full price trumps rushed discount. If buying next, chain timing; investors eye rentals thriving at 80+ days.
Your home’s unique: a turnkey Ahwatukee ranch flies; dated Maryvale needs tweaks.
A Warm Invitation
If you’re wondering how long your Phoenix home might take to sell, know this — you don’t have to figure it out alone. From 30-day wonders in Chandler to strategic plays in West Valley, I’d love to crunch your comps and craft a plan for the swiftest, smoothest close.
Reach out anytime. Let’s turn market realities into your success story — supported, straightforward, and sold on your timeline.
Get the full Phoenix Market Insights → [Market Insights]

-

How the Phoenix Desert Climate Shapes Everyday Life Inside the Home
-

How Phoenix Weather Patterns Shape Everyday Home Routines
-
Why Homes Often Feel More Comfortable After the First Year of Ownership
-
How Living in Phoenix Changes the Way Homeowners Use Their Homes
-
What New Phoenix Homeowners Learn During Their First Year of Ownership
-

How Daily Life Changes After the First Year of Living in a Phoenix Home
-
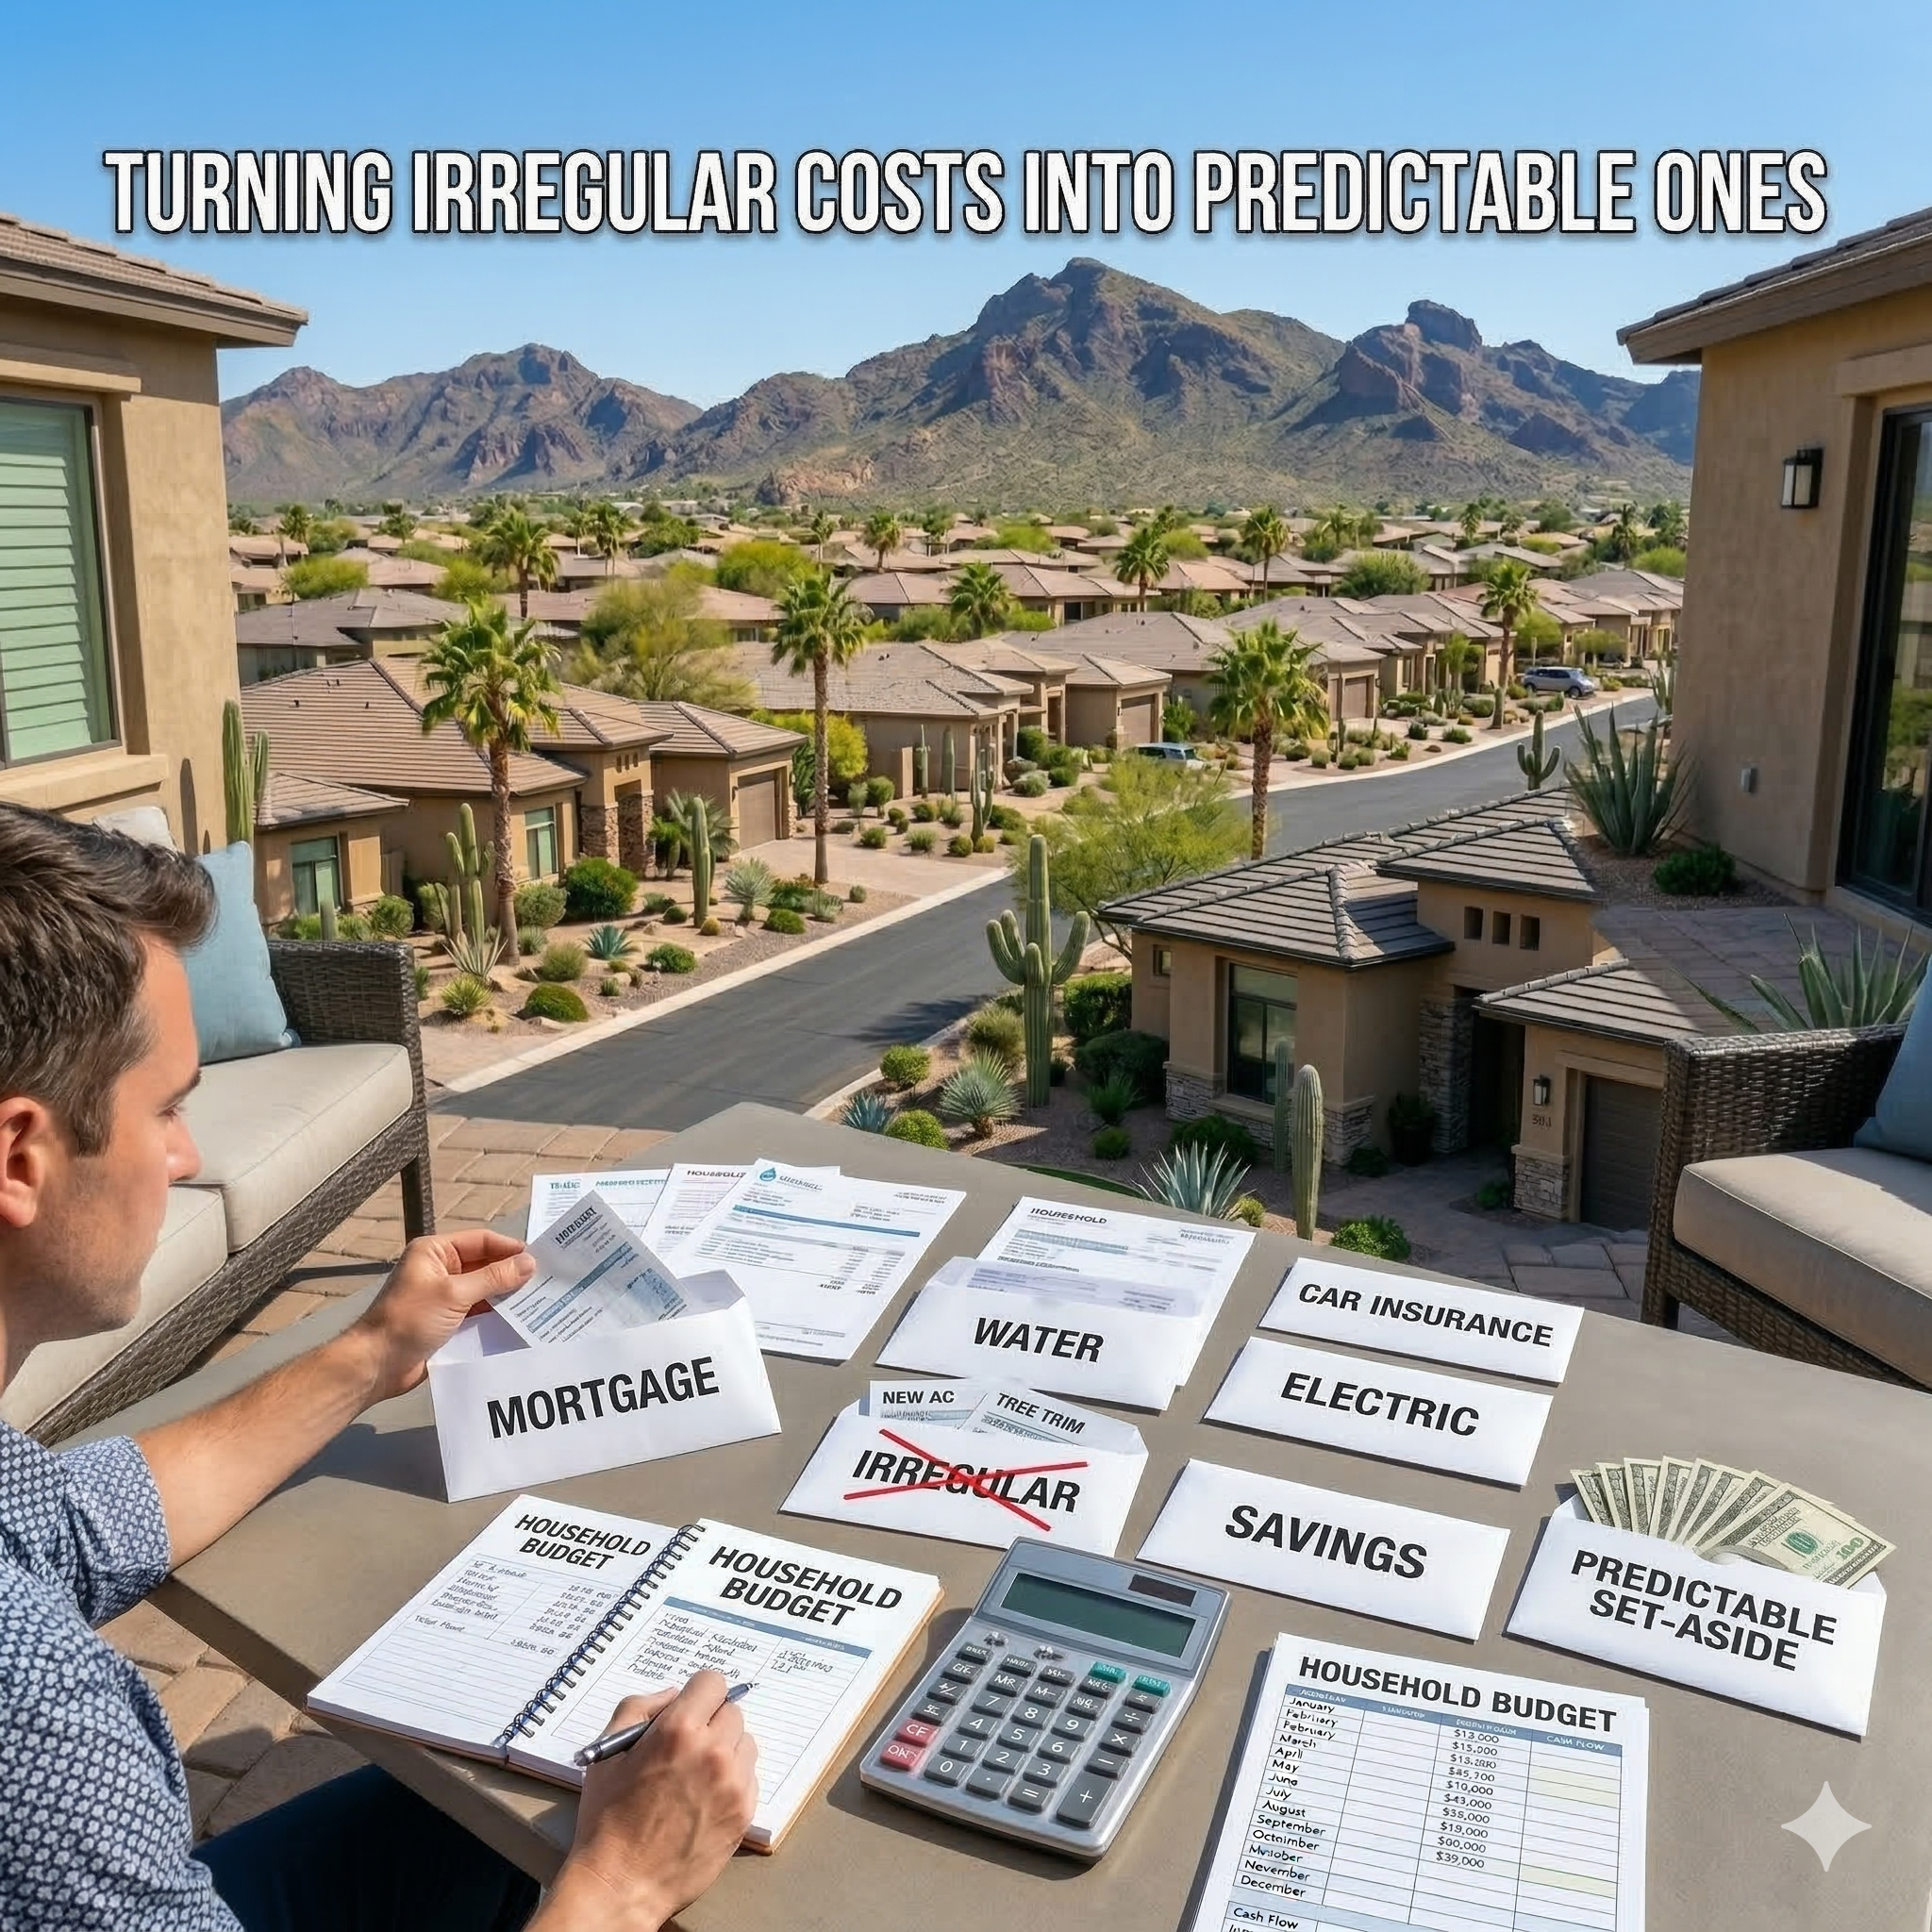
Turning Irregular Costs Into Predictable Ones
-

Budgeting for Ongoing Ownership
-
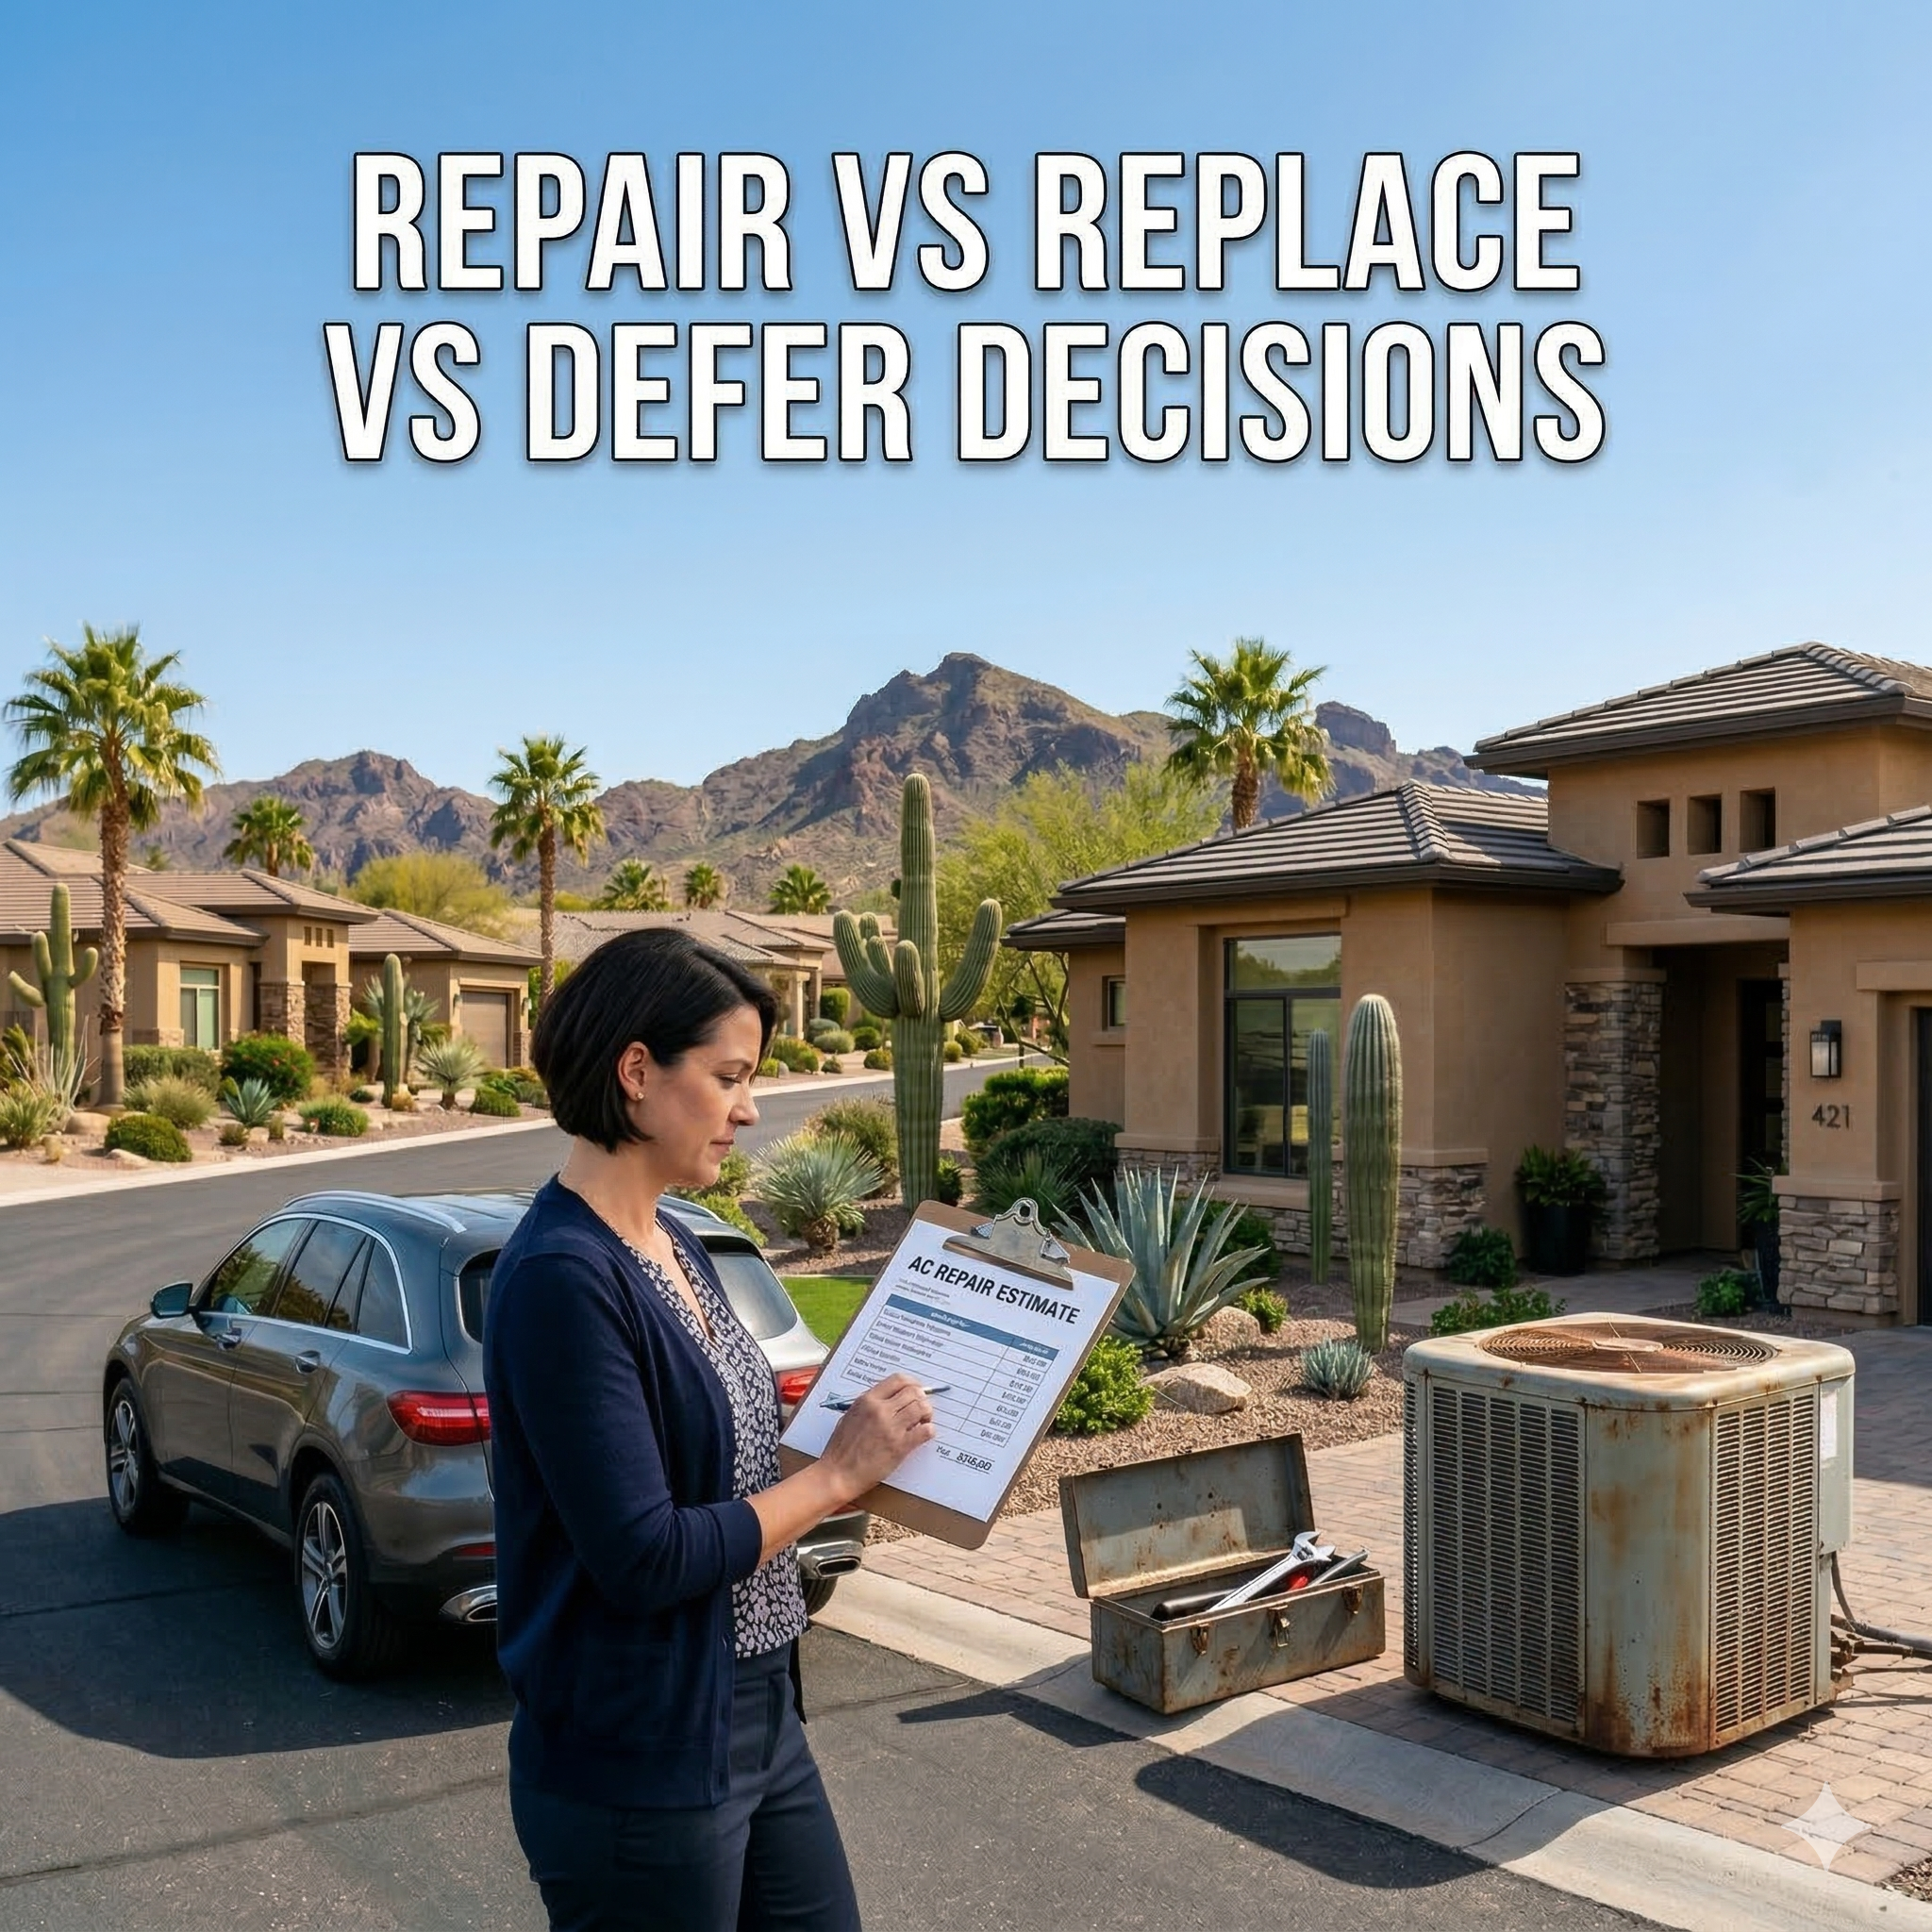
Repair vs Replace vs Defer Decisions
-

Planning Homeownership Like a Long-Term Asset
-

What Home Expenses You Can Safely Delay
-
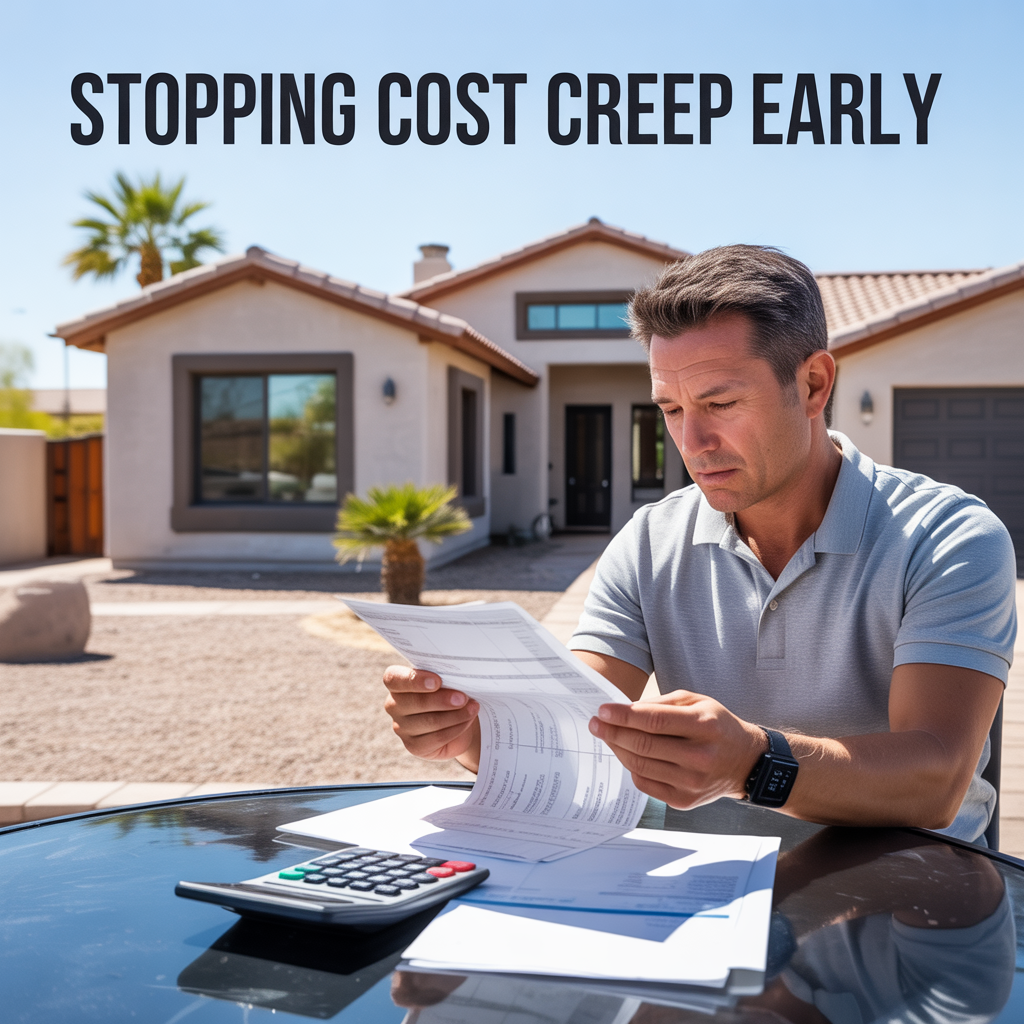
Stopping Cost Creep Early
-

Cash Flow vs Net Worth Stress
-
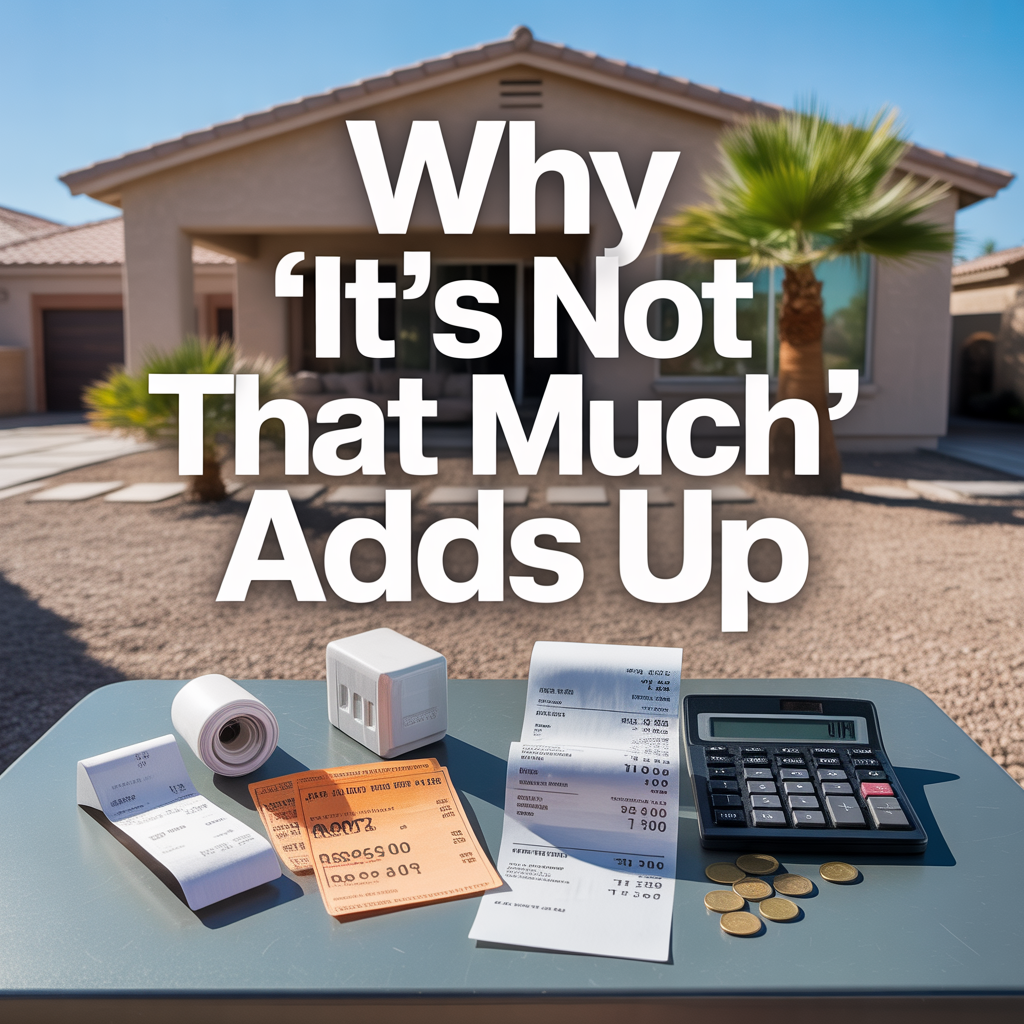
Why “It’s Not That Much” Adds Up
-

Warning Signs Your Ownership Budget Is Tightening
-

The Cumulative Cost of Small Home Repairs
-

Designing Budgets Around Local Conditions
-
Utility Costs Over Time in Desert Climates
-

Insurance Increases Explained for Arizona Homeowners
-
How Inflation Impacts Phoenix Homeownership Costs
-

Avoiding Debt-Driven Homeownership Decisions
-

Replacing Systems on Your Timeline
-

Why Emergency Repairs Cost More
-

Timing Major Expenses Without Financial Shock
-
How Much to Keep in a Phoenix Home Reserve Fund