


Phoenix Lifestyle Guide → [Phoenix Lifestyle Guide] & For more info on Phoenix Real Estate → [Phoenix Real Estate Guide]
Written by: Renee Burke
Phoenix home values have seen remarkable shifts over the past decade, shaped by everything from the pandemic boom to today’s more balanced market. As someone who’s walked countless buyers and sellers through this Valley terrain, I’ve watched it unfold—from the steady climbs of the mid-2010s to the dizzying peaks and now a gentle recalibration.
It’s not just numbers on a chart. These changes reflect how families have grown here, jobs have multiplied, and lifestyles have evolved amid our desert sunsets and mountain views. Let’s walk through the timeline together, suburb by suburb, so you can see the full picture.
The Steady Climb: 2016–2019
Back in 2016, the median home price in greater Phoenix hovered around $250,000 to $275,000. It was a solid, predictable market—families snapping up single-family homes in Gilbert or Chandler, young professionals eyeing Tempe condos. Annual appreciation ran about 5-7%, fueled by job growth in tech and healthcare, and an influx of relocators from California seeking more space for their money.
By 2019, values had climbed to roughly $320,000 median, a 25-30% gain over three years. Scottsdale’s luxury enclaves like DC Ranch saw even stronger jumps, often 8-10% yearly, as high-end buyers poured in. East Valley spots like Queen Creek grew steadily too, with new builds drawing families to master-planned communities. This era felt sustainable—like Phoenix was coming into its own as a true destination.
Pandemic Surge: 2020–2022
Then came 2020, and everything accelerated. Remote work flipped the script. Median prices shot past $400,000 by late 2021, up over 50% from 2019 lows in some areas. Bidding wars became the norm; homes in Peoria or Glendale sold sight unseen, often $50,000 over ask.
Scottsdale and Paradise Valley led the charge—values doubled in prime spots, with South Scottsdale jumping from $500K medians to nearly $1 million. Gilbert and Chandler held strong too, as families fled cramped city apartments for backyards and pools. Even further-out areas like San Tan Valley saw 40-60% gains, blending affordability with that wide-open Arizona appeal.
By 2022’s peak, metro Phoenix medians touched $475,000-$500,000. It was exhilarating for sellers but exhausting for buyers, who wondered if they’d ever catch a break.
The Cooling Phase: 2023–2025
Higher interest rates hit like a desert monsoon in 2023, slowing the frenzy. Inventory crept up—highest since 2017 in some reports—and prices softened. Medians dipped to $440,000-$460,000 by mid-2024, down 5-10% from peaks in hotter segments.
East Valley held resilient; Gilbert values stabilized around $550K, buoyed by top schools and Intel’s presence. Mesa offered relief for first-timers, with steady 2-3% drops bringing values back to 2021 levels. Northwest suburbs like Peoria saw sharper corrections—10-15% off highs—as newer inventory competed.
Luxury didn’t escape: DC Ranch and Silverleaf eased 5-8%, giving discerning buyers room to negotiate. Overall, appreciation flipped to flat or slight declines, with closed sales ticking up modestly by 2025.
Today’s Landscape: Early 2026 Snapshot
As of February 2026, Phoenix medians sit around $400,000-$455,000, down 3-4% year-over-year per recent indices. It’s a buyer-friendly shift—days on market around 60-70, sale-to-list ratios near 97-98%. Inventory at 18,000+ listings offers choices, yet no oversupply thanks to the “lock-in effect”—homeowners clinging to sub-5% rates.
Suburb highlights:
- Scottsdale: $800K+ medians, down 2-5% but stable in prestige pockets.
- Gilbert/Chandler: $500K-$600K, minimal change, family demand anchors.
- Mesa: $400K range, 3-5% softer, value-driven.
- Peoria/Glendale: $450K, 5-10% from peaks, lifestyle perks shine.
- Queen Creek: $550K, steady growth at 2-3% as sprawl continues.
What Drives These Changes?
Phoenix’s story isn’t random. Population boomed—nearly 2 million more residents in 25 years—pushing demand. Semiconductors (TSMC, Intel) and healthcare hubs stabilized jobs. New construction lagged, keeping supply tight despite recent upticks.
Lifestyle matters too. Buyers crave patios for winter BBQs, trails for hikes, communities for kids. Corrections hit overpriced flips hardest, but core family neighborhoods endured. Misconception: “Prices always crash here.” Reality: No 2008 repeat—structural shortages prevent it.
Lessons for Buyers and Sellers
For sellers, timing aligns with stability—spring listings in strong suburbs like Gilbert move best. Price realistically; concessions are common now. Buyers, rejoice: Negotiate closing costs, tour thoughtfully. Values likely hold or inch up 1-3% in 2026 with rates steady at 6%.
Phoenix rewards the patient. We’ve grown from $250K medians to double that, netting wealth for early movers while opening doors for today’s newcomers.
If you’re thinking about making a move in Phoenix, you don’t have to figure it out alone. Whether sizing up your home’s value journey or plotting the next chapter, I’d love to share what I’ve seen across the Valley. Let’s chat—your story here is just beginning.
Get the full Phoenix Market Insights → [Market Insights]

-
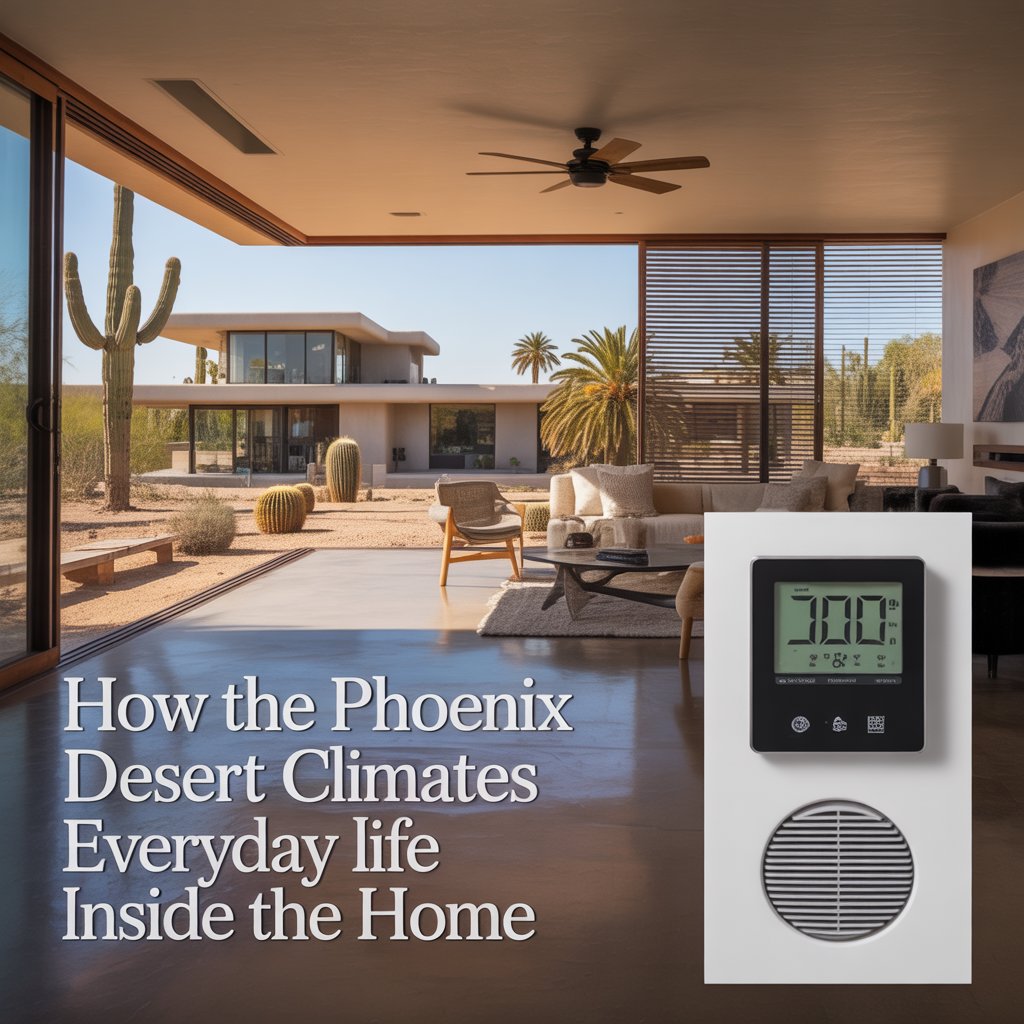
How the Phoenix Desert Climate Shapes Everyday Life Inside the Home
-
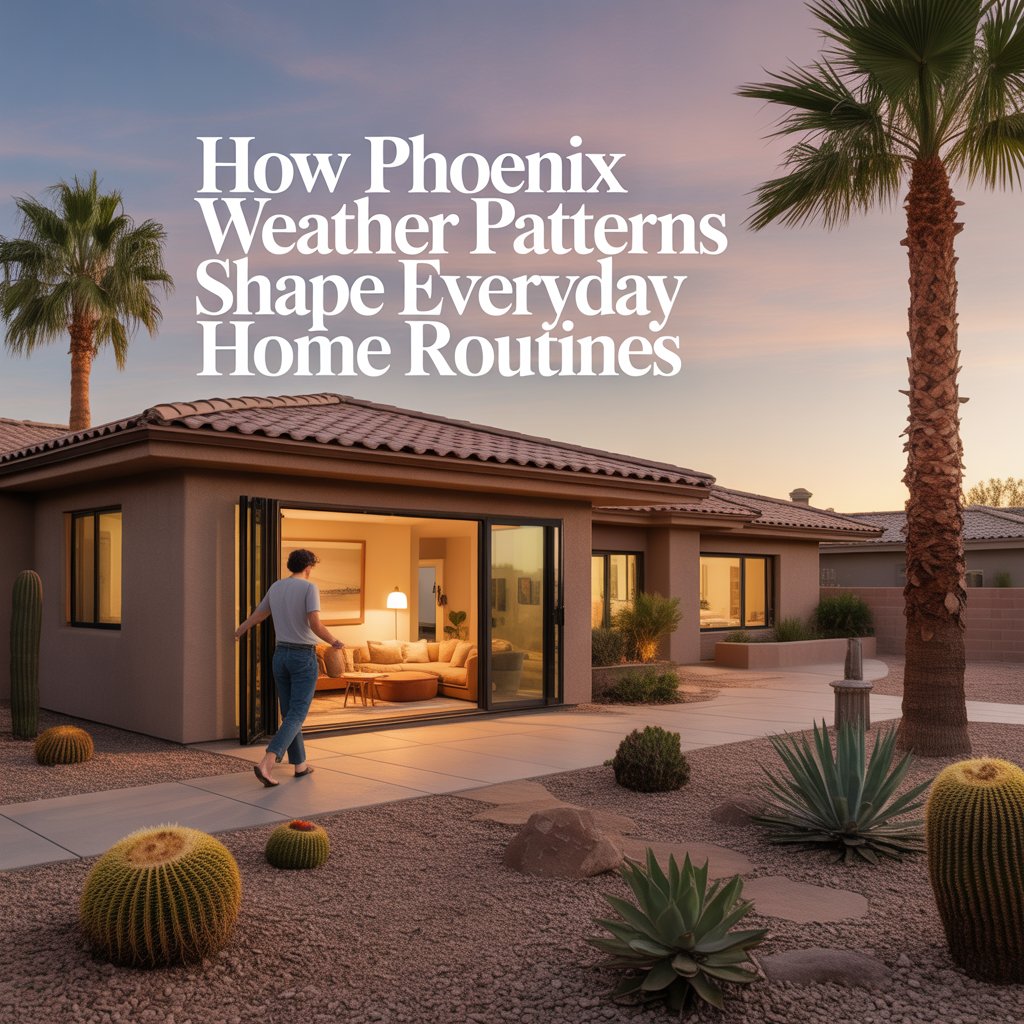
How Phoenix Weather Patterns Shape Everyday Home Routines
-
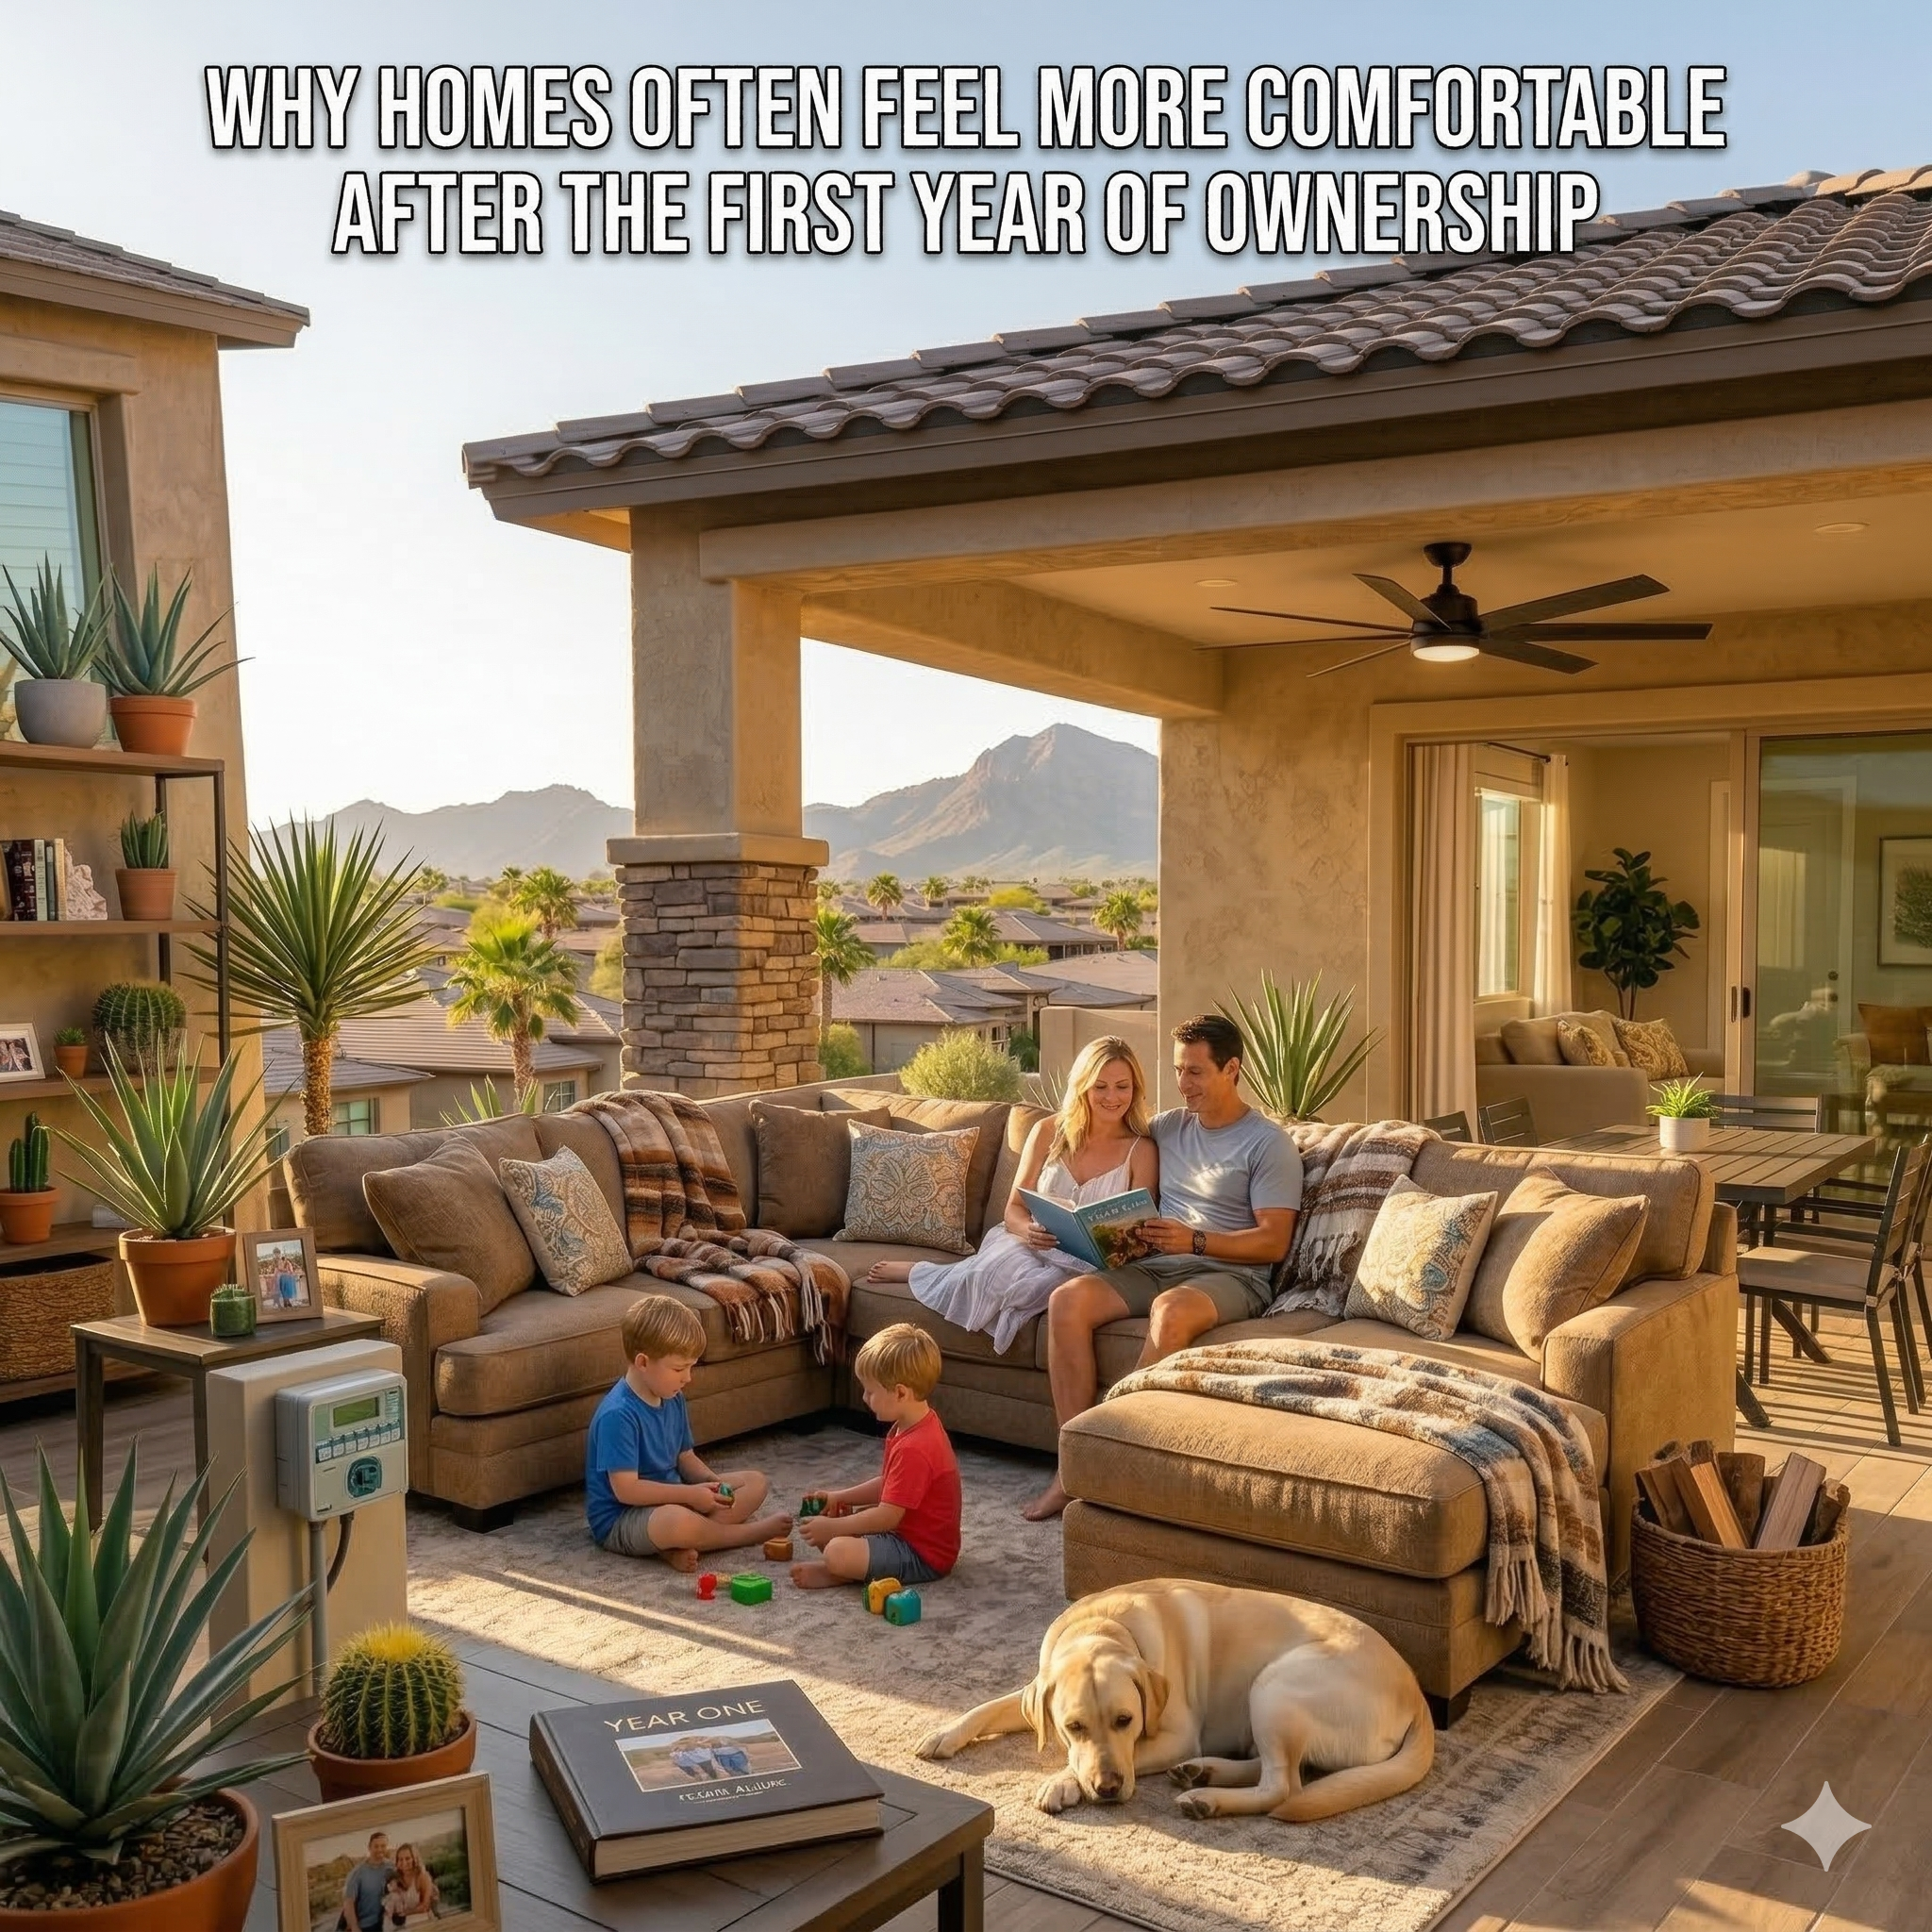
Why Homes Often Feel More Comfortable After the First Year of Ownership
-
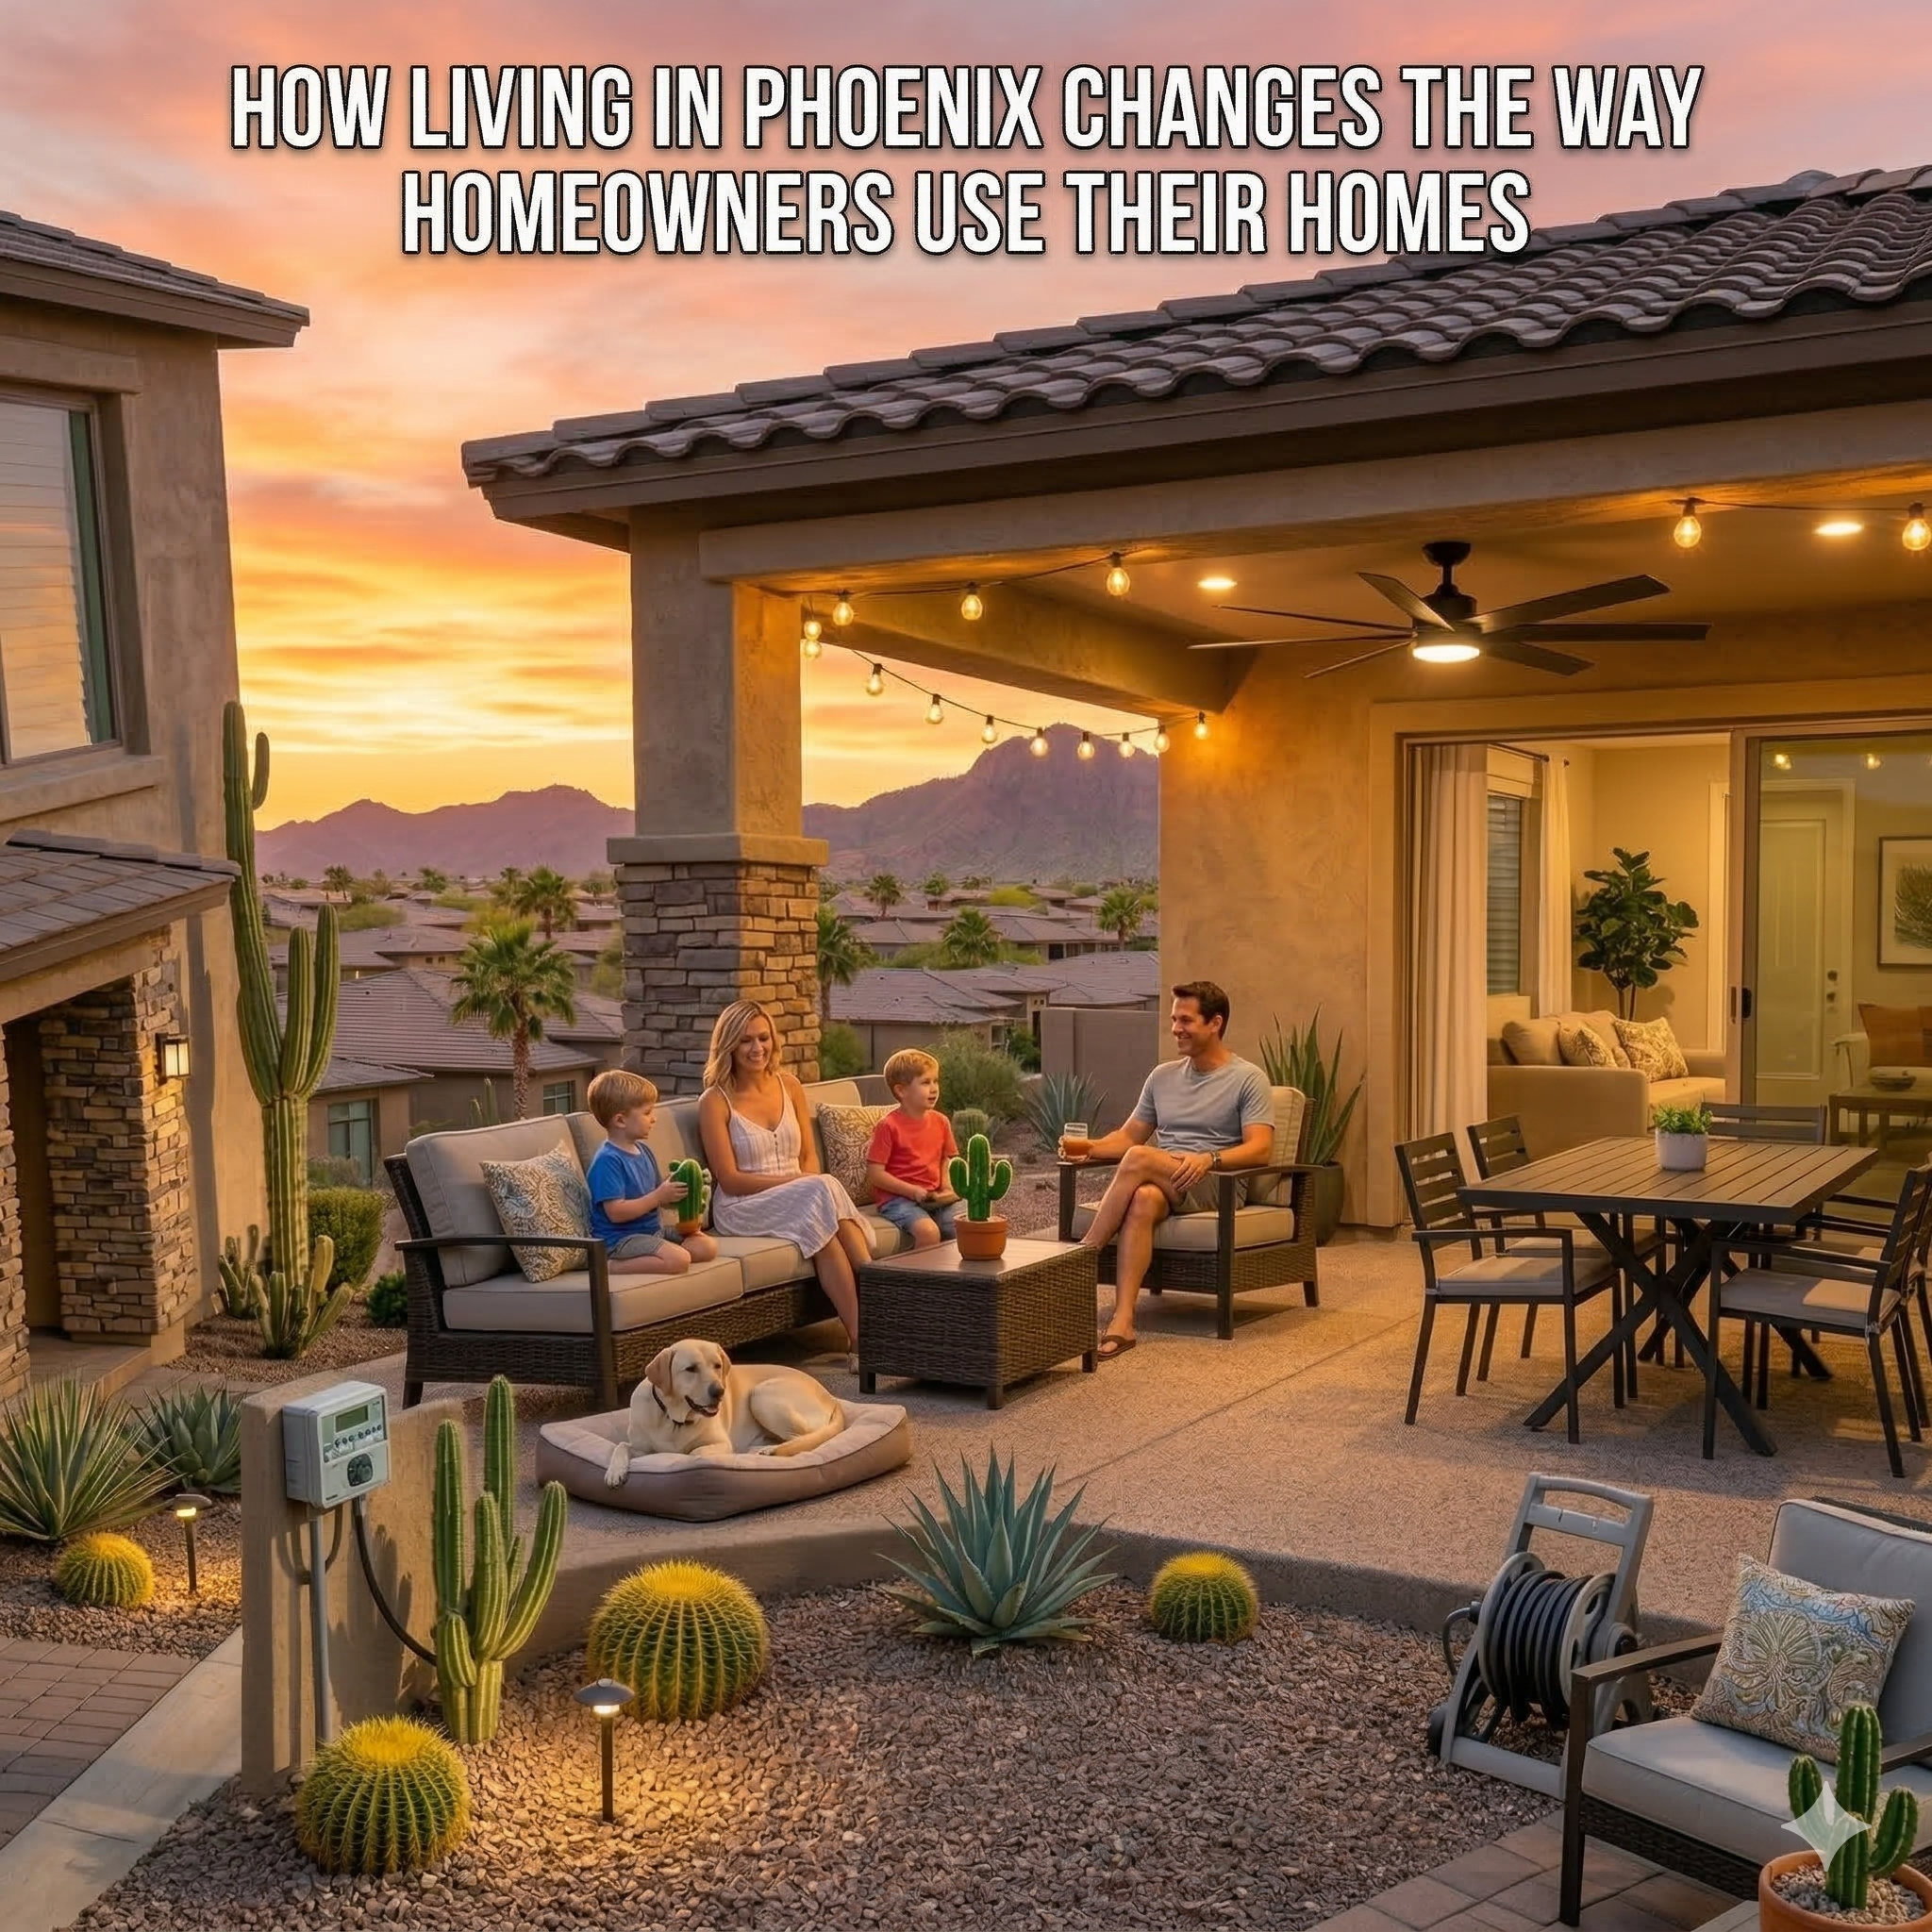
How Living in Phoenix Changes the Way Homeowners Use Their Homes
-
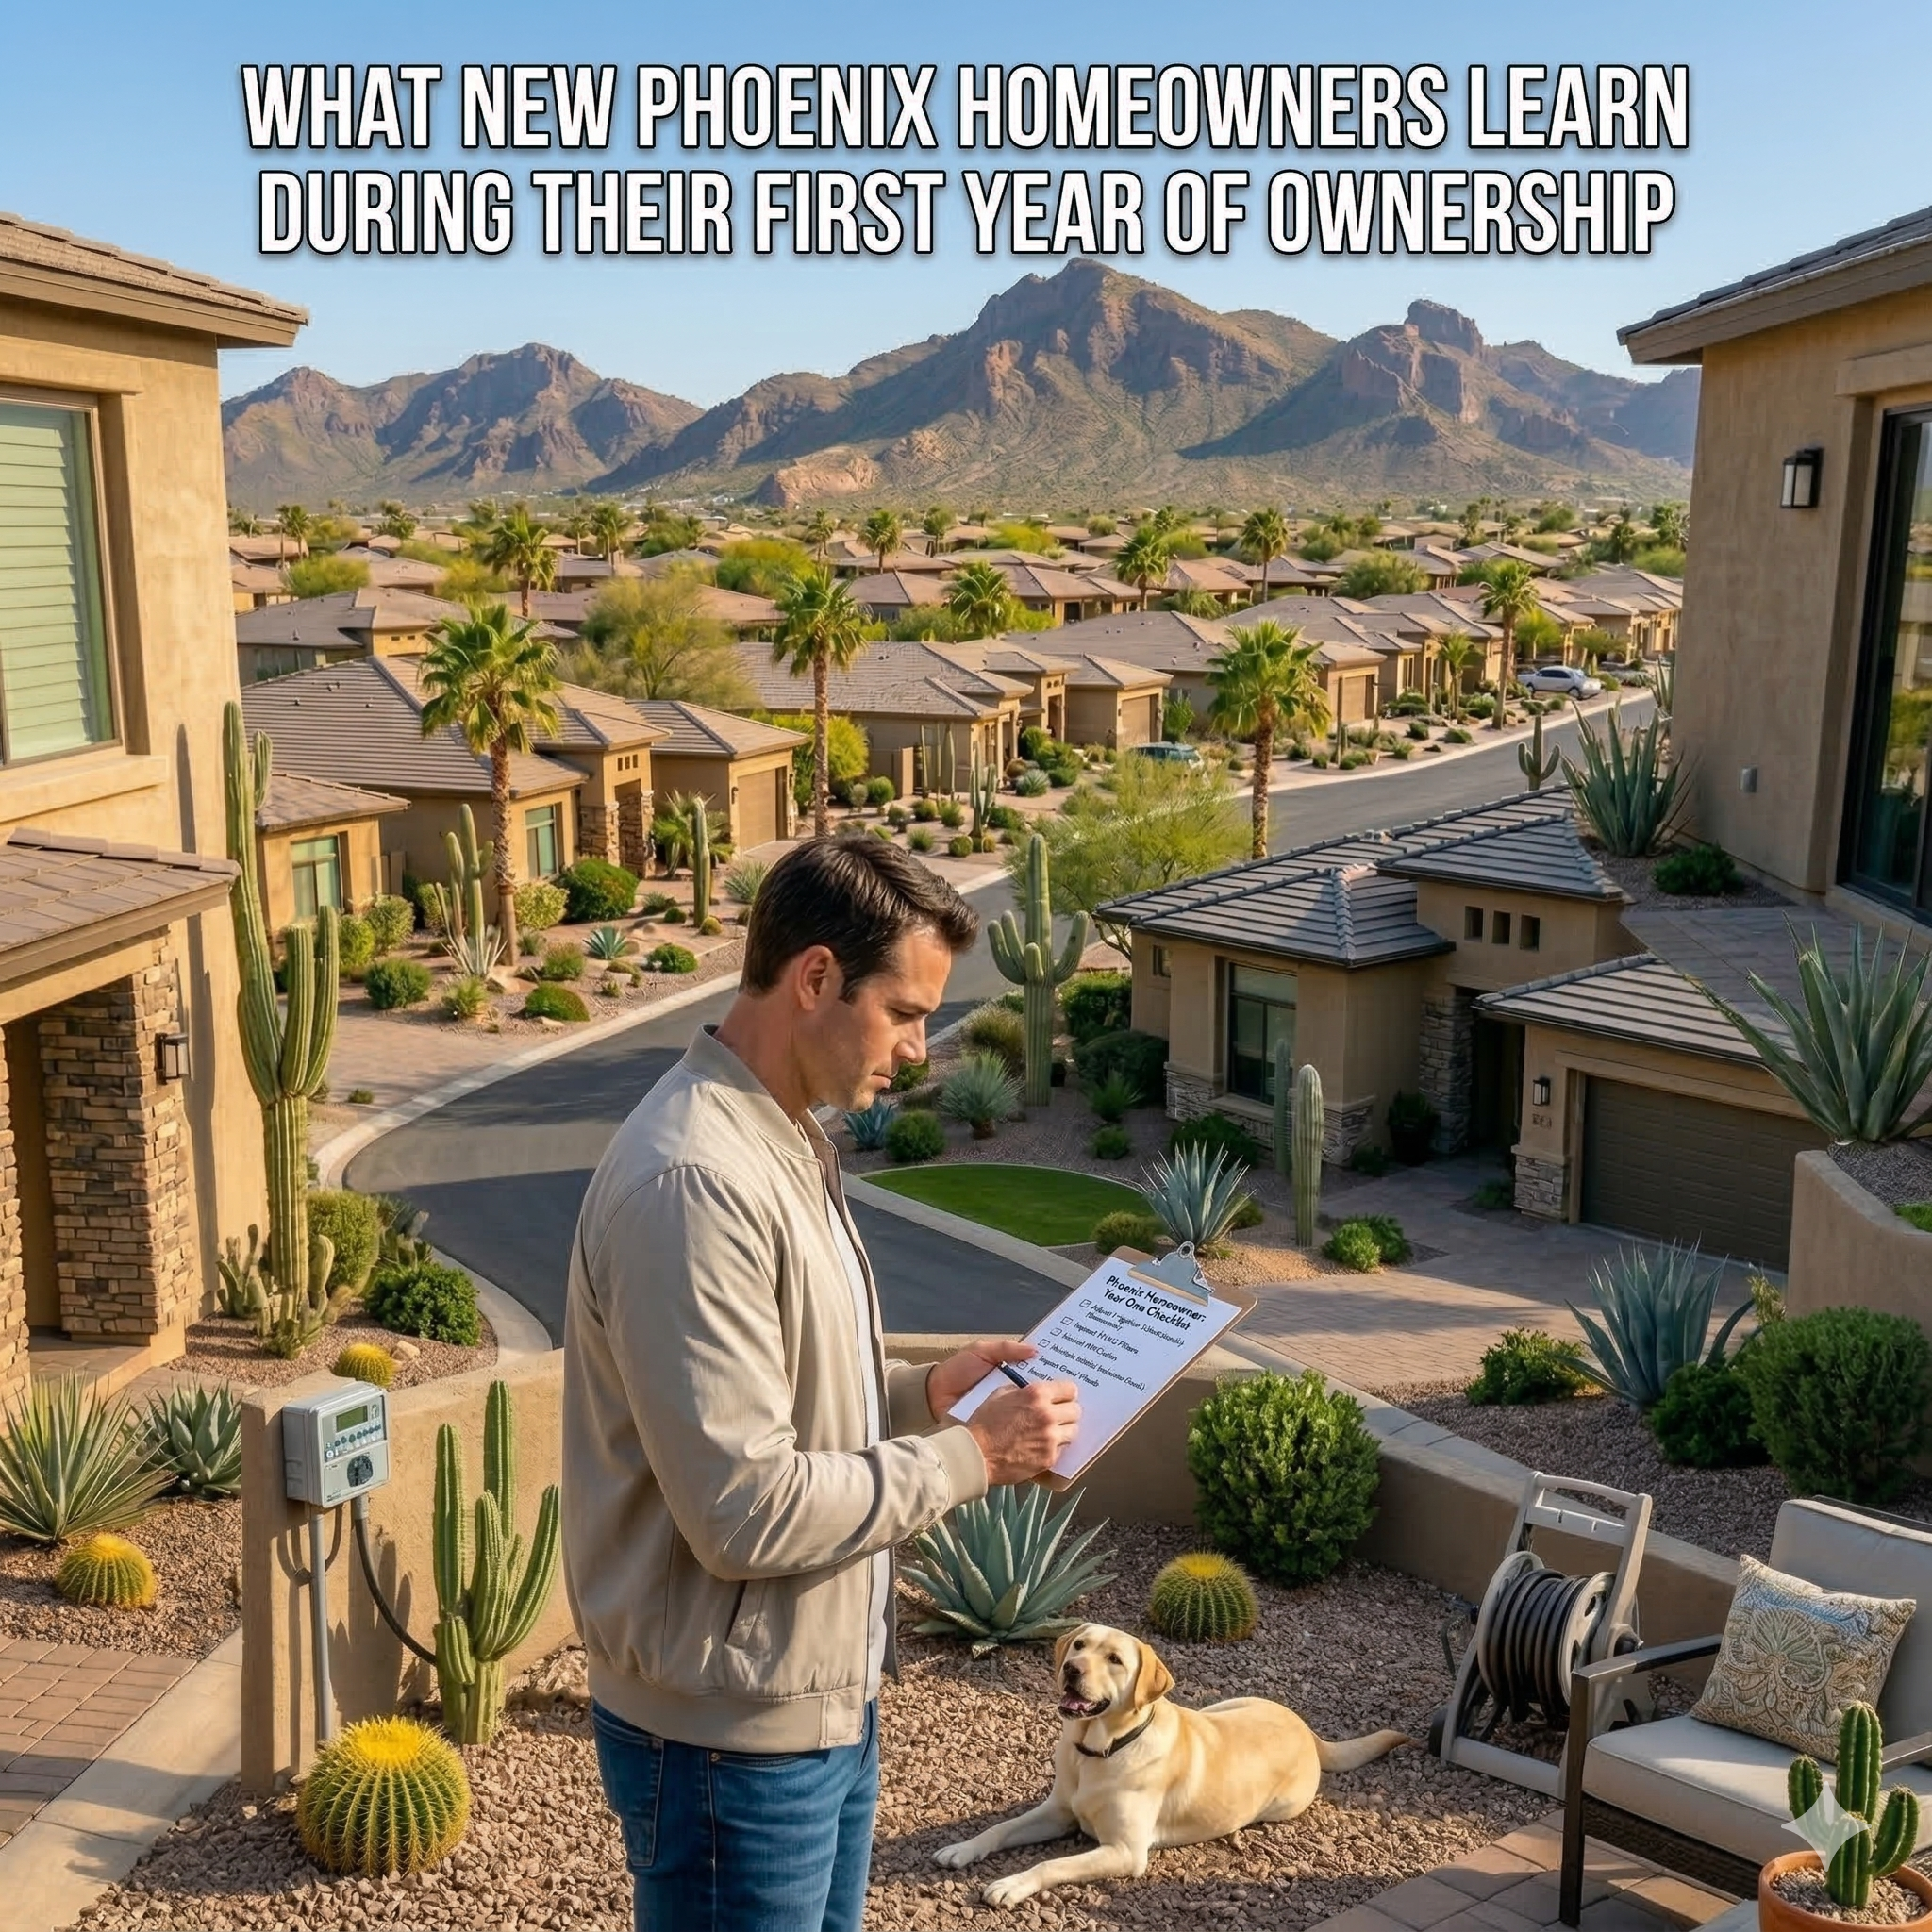
What New Phoenix Homeowners Learn During Their First Year of Ownership
-

How Daily Life Changes After the First Year of Living in a Phoenix Home
-
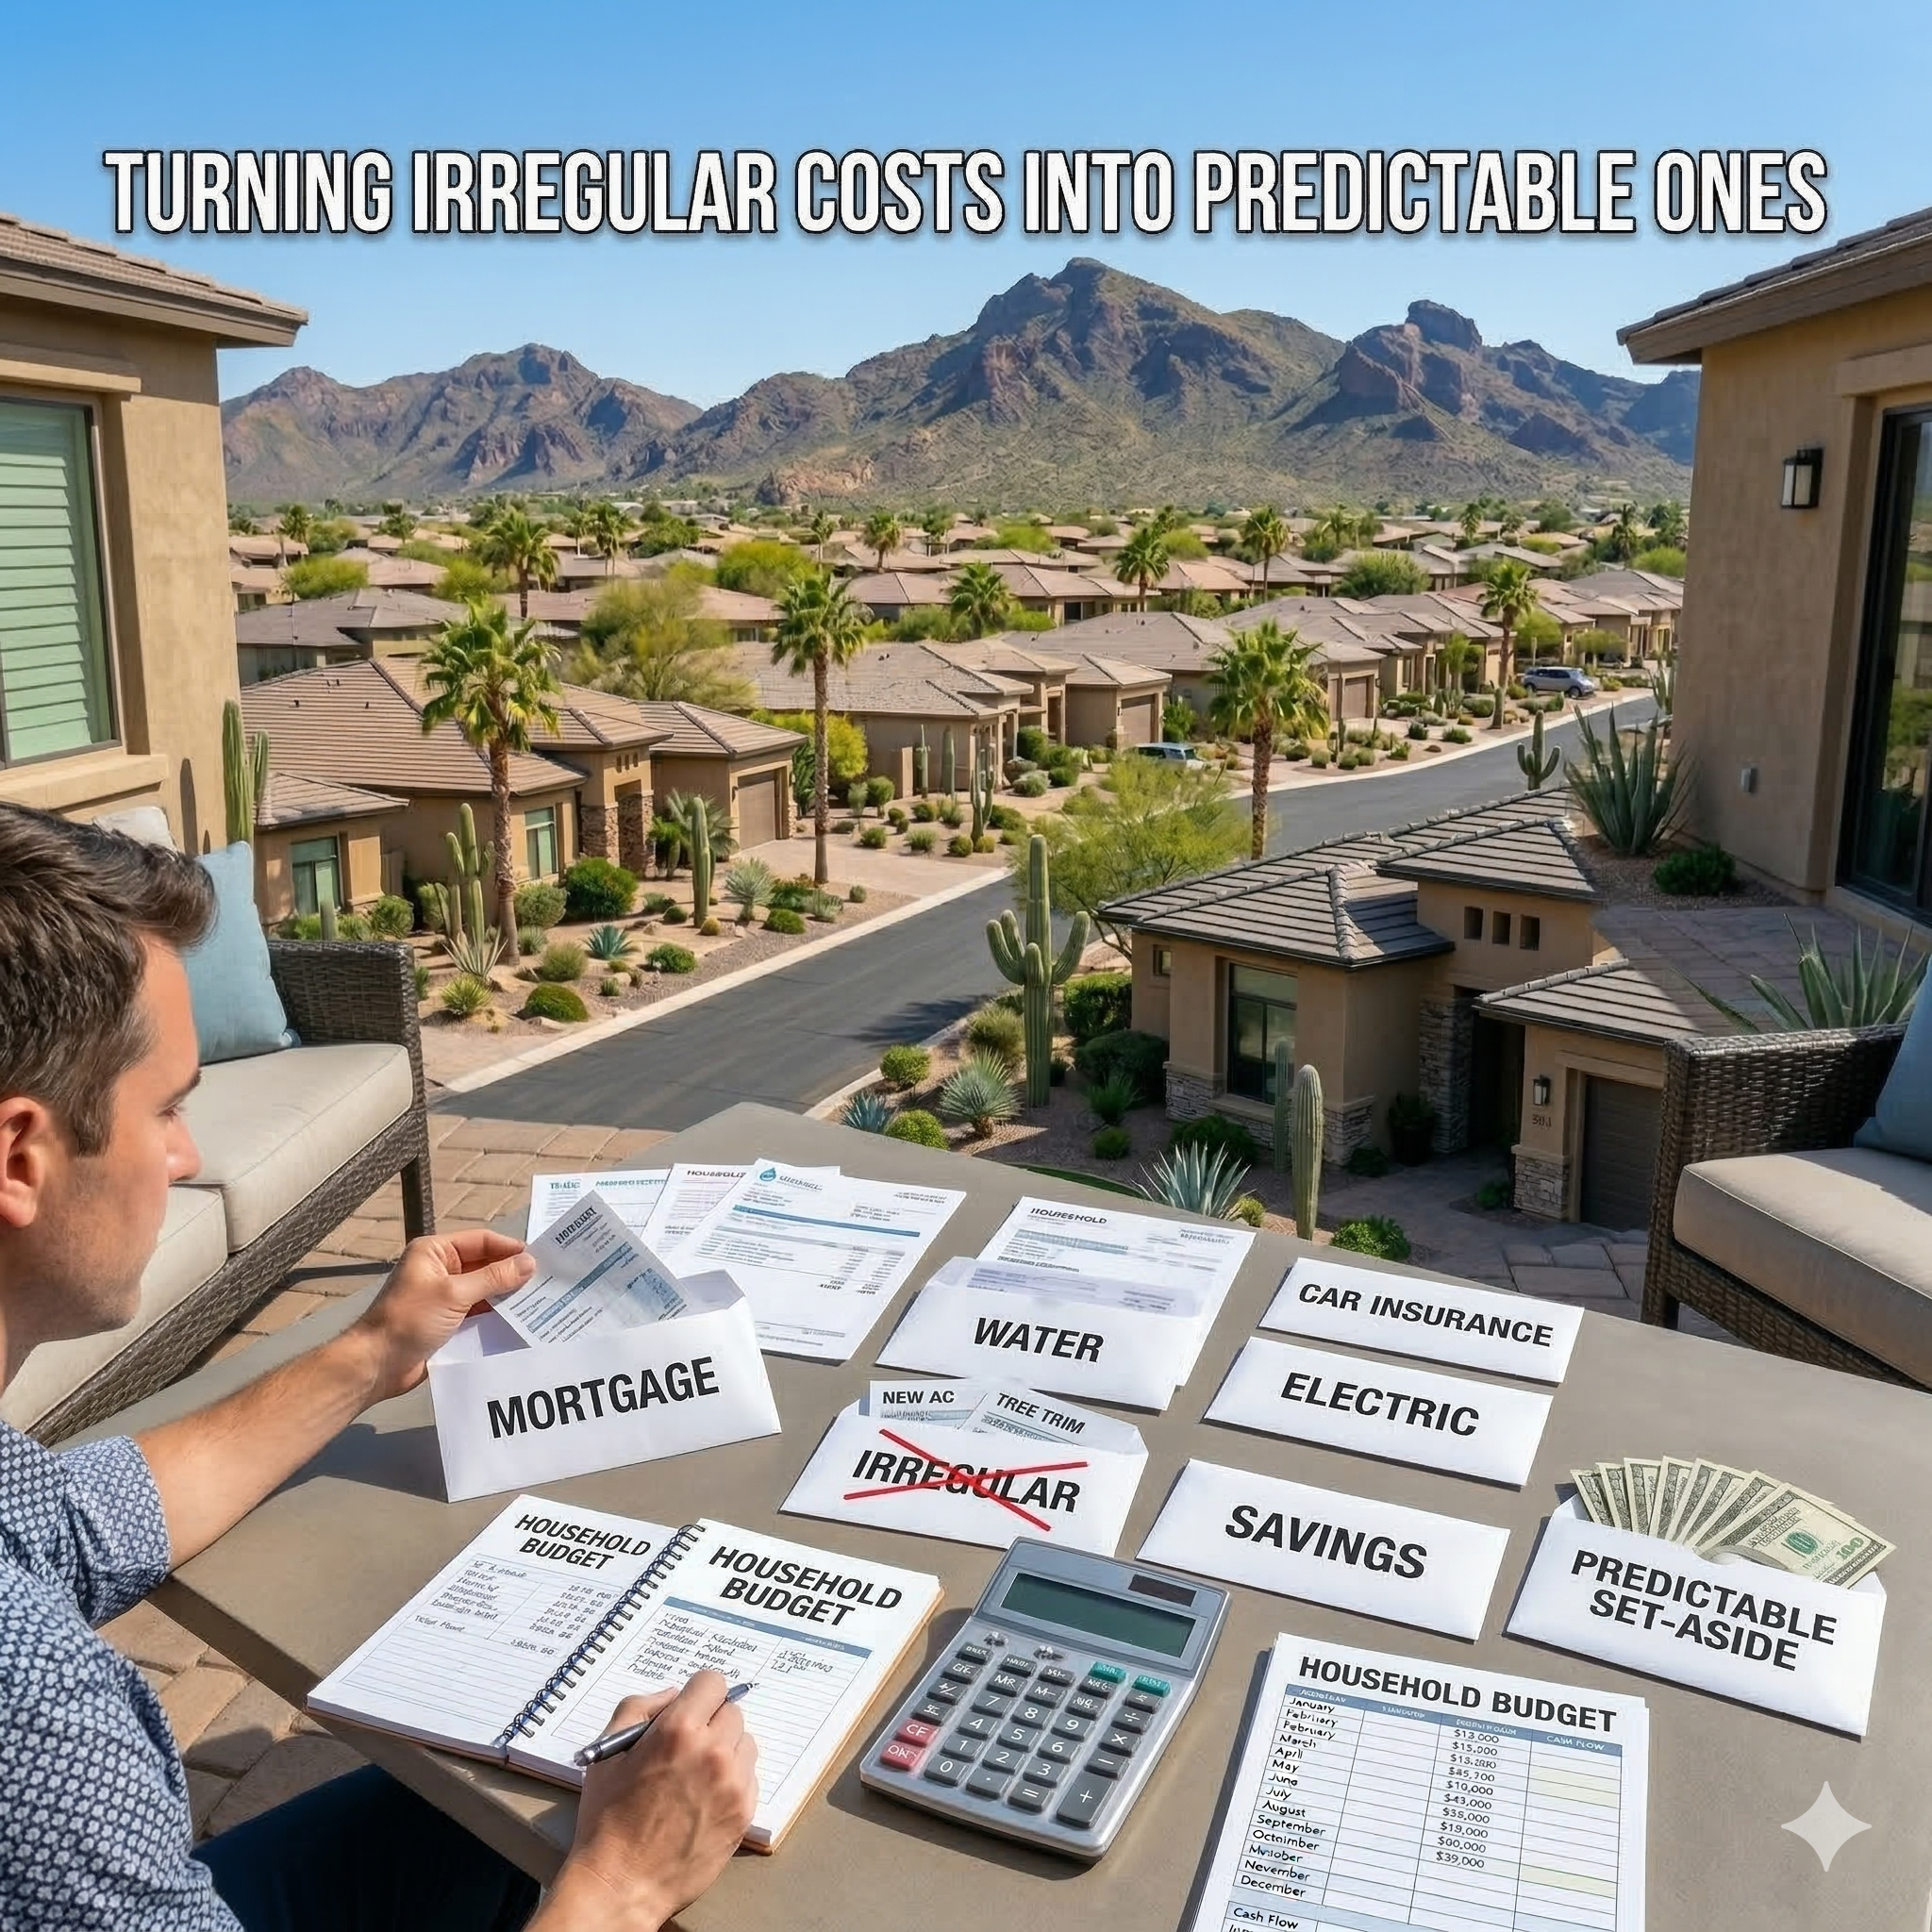
Turning Irregular Costs Into Predictable Ones
-

Budgeting for Ongoing Ownership
-
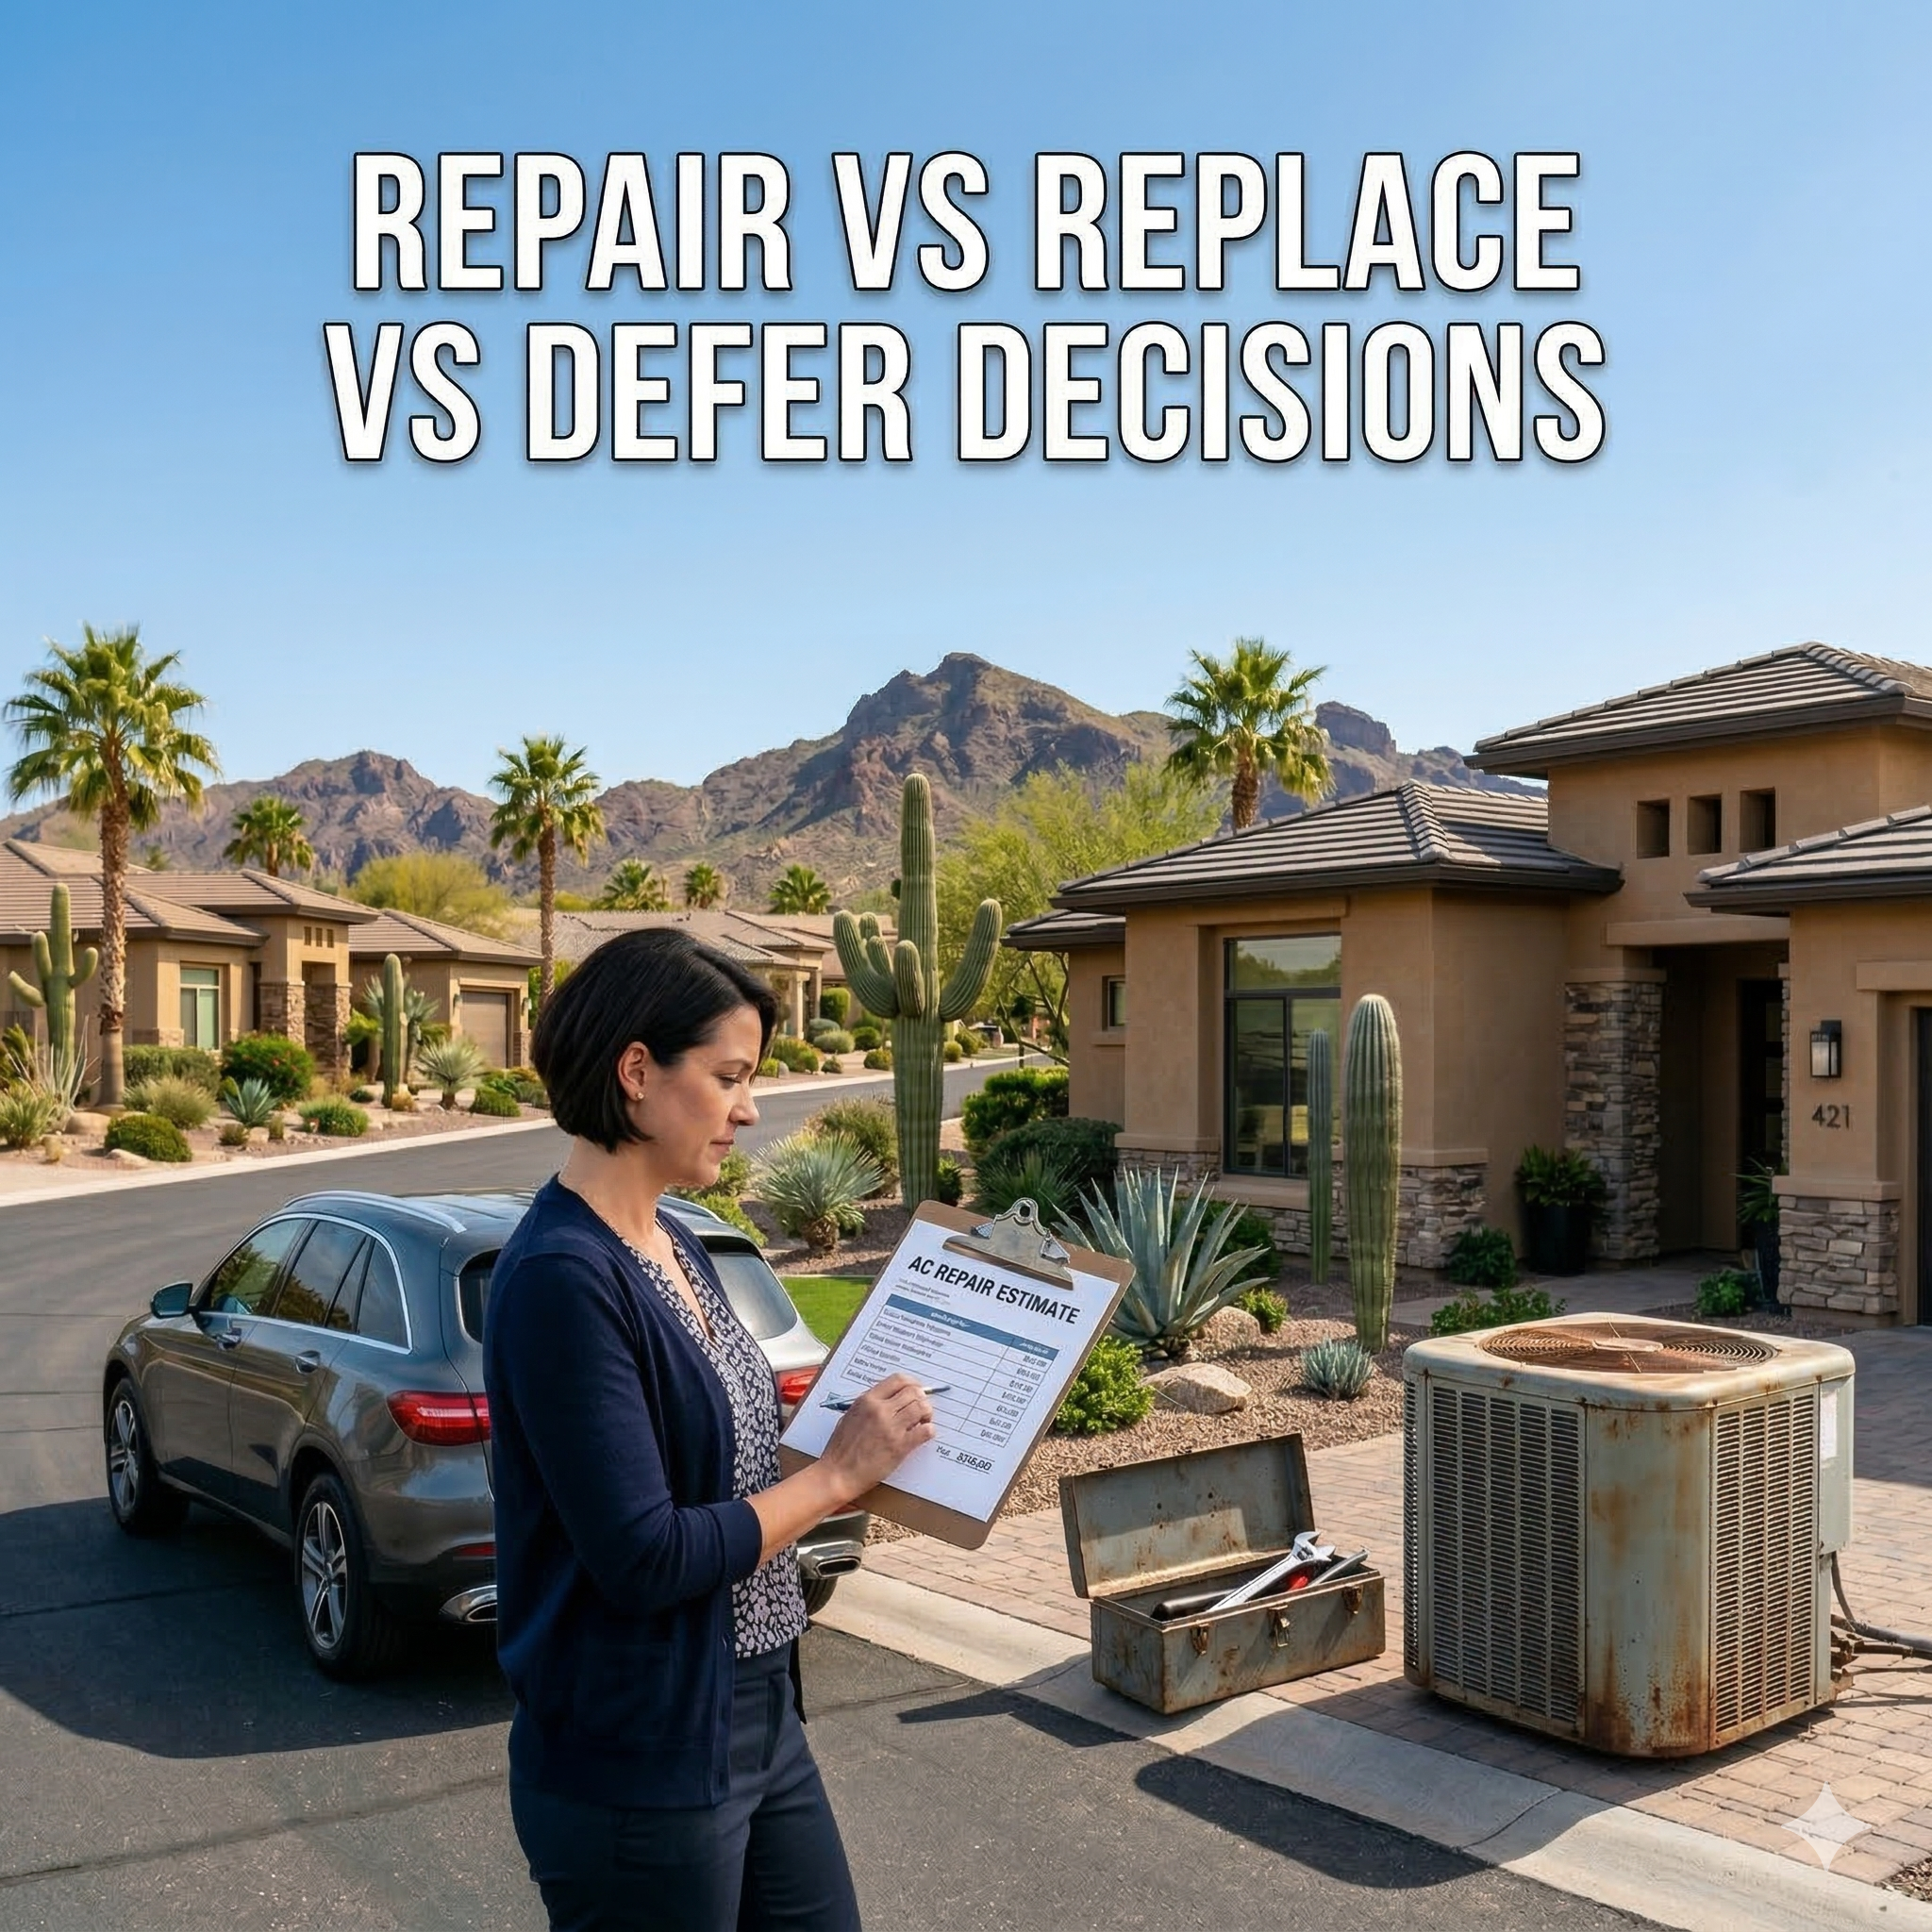
Repair vs Replace vs Defer Decisions
-

Planning Homeownership Like a Long-Term Asset
-

What Home Expenses You Can Safely Delay
-
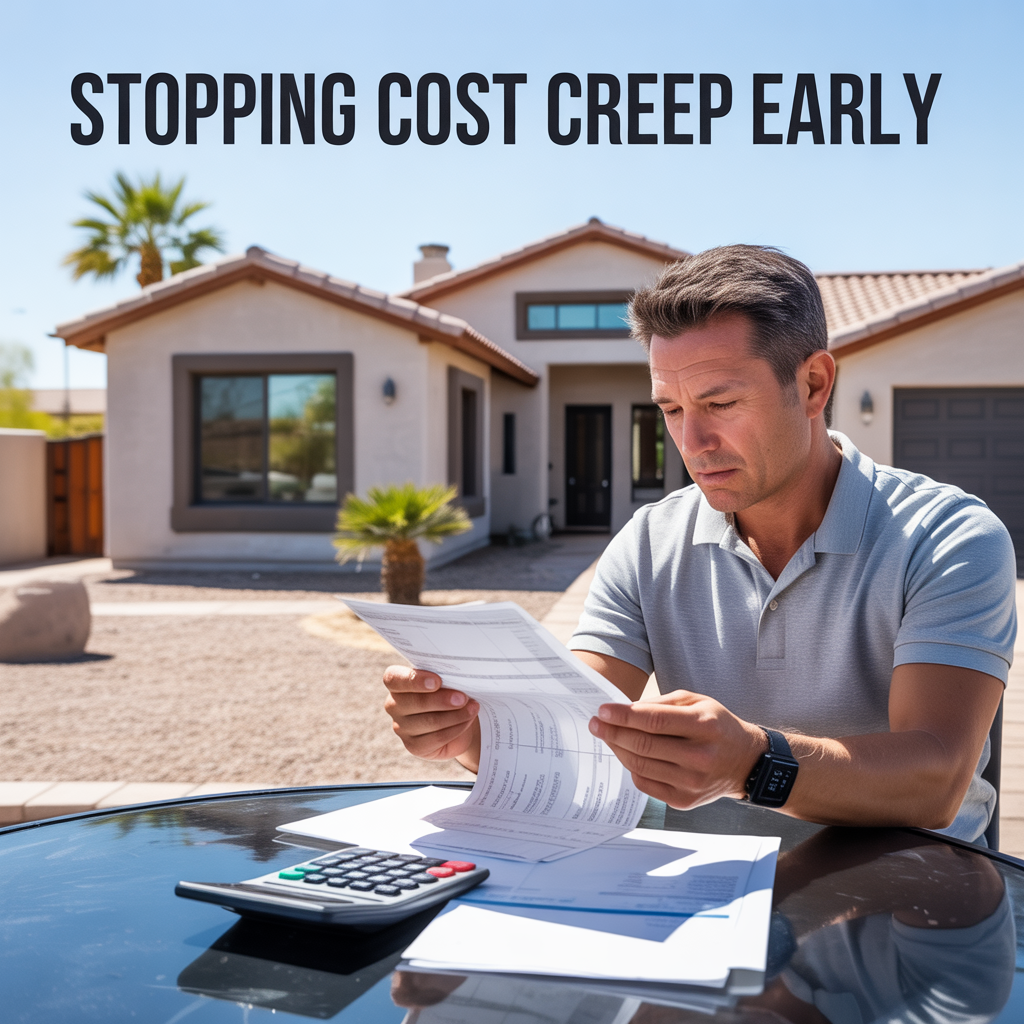
Stopping Cost Creep Early
-

Cash Flow vs Net Worth Stress
-
Why “It’s Not That Much” Adds Up
-
Warning Signs Your Ownership Budget Is Tightening
-
The Cumulative Cost of Small Home Repairs
-
Designing Budgets Around Local Conditions
-
Utility Costs Over Time in Desert Climates
-

Insurance Increases Explained for Arizona Homeowners
-
How Inflation Impacts Phoenix Homeownership Costs
-

Avoiding Debt-Driven Homeownership Decisions
-

Replacing Systems on Your Timeline
-

Why Emergency Repairs Cost More
-

Timing Major Expenses Without Financial Shock
-
How Much to Keep in a Phoenix Home Reserve Fund