


Buyer Fears→ [Buyer Fears] & For more info on other fears Phoenix Real Estate → [Phoenix Real Estate Fears Guide]
Written by: Renee Burke
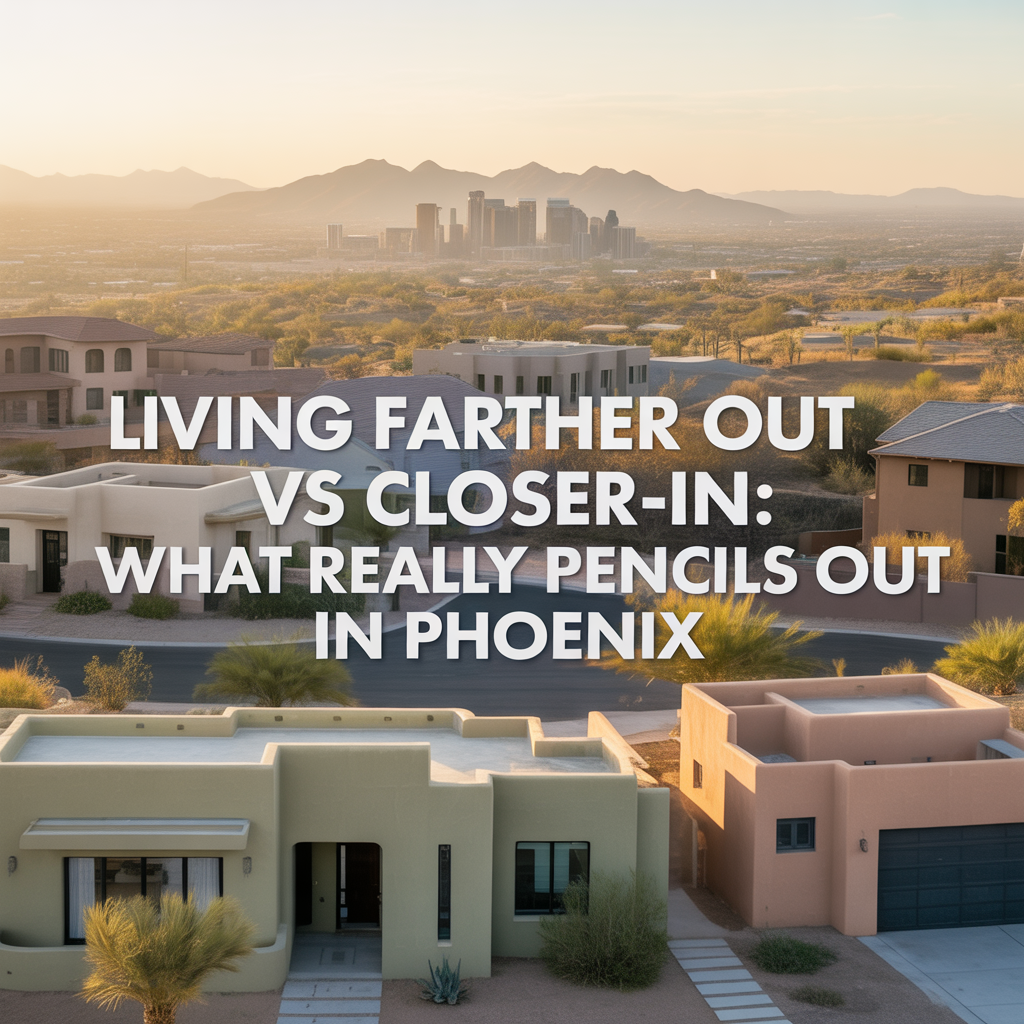
Phoenix’s metro sprawl offers a classic trade-off: vibrant urban cores like Downtown or Tempe versus spacious suburbs in Queen Creek or Buckeye. Farther-out living tempts with bigger homes and yards, while closer-in spots promise walkability and shorter drives. After years guiding families through these choices, I’ve crunched the numbers—it’s rarely just about price; lifestyle, hidden costs, and long-term appreciation tip the scales.
In our Valley market, where home prices softened slightly into 2026 after peaking in 2022, the math favors intentional picks. Let’s break it down calmly, so you see what fits your budget and dreams.
Upfront Housing Costs
Closer-in Phoenix (Downtown, Roosevelt Row, Central Corridor) carries premium tags—median homes hover $450K-$600K for condos or townhomes under 2,000 sq ft. Rents start at $1,800 for a one-bedroom, reflecting demand from young pros and ASU families.
Farther out (San Tan Valley, Goodyear, far East Gilbert), you snag 4-bedrooms with pools for $500K-$650K, often 3,000+ sq ft on larger lots. New builds in Verrado or Eastmark stretch to $700K but include upgrades.
Surprise: Core Phoenix proper ($52K annual living costs) undercuts suburbs like Scottsdale ($87K) or Gilbert ($63K). Suburbs win on space-per-dollar, but not always total affordability.
Monthly Ownership Breakdown
Mortgage, taxes, insurance, and HOA paint the full picture at 6.5% rates.
| Category | Closer-In (e.g., Downtown) | Farther-Out (e.g., Buckeye) |
|---|---|---|
| Median Home Price | $525K | $575K |
| Monthly P&I | $3,300 | $3,600 |
| Property Taxes | $300 (1.1% rate) | $350 (higher AV) |
| HOA (if appl.) | $250-$400 | $100-$200 |
| Utilities | $175 (smaller space) | $250 (AC, pool) |
| Total Monthly | $4,200 | $4,700 |
Farther-out edges higher on bills—summer electric for sprawling homes spikes 30-50%. But no-parking-fee urban condos save $150/month.
Commute and Transport Realities
The killer variable: time and gas. Closer-in to jobs (Sky Harbor, Intel Chandler)? 15-25 minutes, $100/month fuel. Light rail zips Downtown to Mesa for $64 passes.
Farther-out: 35-60 minutes to core hubs via I-10/Loop 303, $250+ gas amid $3.50/gallon. HOV shaves time, but monsoons add 20 minutes. Hybrids or remote work balance it.
Reality check: Suburbs like Queen Creek grew 10% yearly—new employers (TSMC North) shorten effective drives.
Lifestyle and Hidden Expenses
Urban perks: Walk to breweries, festivals, light rail—no car needed half the time. Dining, culture thrive; schools vary (Roosevelt excels).
Suburban draws: Top-rated districts (Gilbert Unified), trails, space for kids/pets. Grocery runs cheaper at Fry’s vs. urban Sprouts premiums. But car-dependent: two vehicles standard, insurance $200/month each.
Healthcare access: Core near Banner; outer needs 20-minute drives. Appreciation favors suburbs—East Valley up 4% yearly vs. urban flats.
| Lifestyle Factor | Closer-In Wins | Farther-Out Wins |
|---|---|---|
| Walkability | Coffee shops, events | Parks, but drive-focused |
| Schools | Improving charters | A+ districts |
| Weekend Vibes | Concerts, nightlife | Hiking, community pools |
| Family Fit | Singles/couples | Growing families |
Long-Term Math: 5-10 Years Out
Appreciation pencils urban steady (2-3% annual) from density; suburbs boom (4-6%) on expansion. Equity builds faster outward if you trade up.
Taxes rise slower core-side (rebates for historic). Resale: Urban quick to transplants; suburbs to families chasing yards.
Net: $100K saved upfront farther out compounds, but add $15K/year transport/lifestyle if car-heavy.
When Farther Out Wins
Growing families, remote/hybrid workers, or equity-builders. Buckeye’s $325K starters + strong schools pencil best under $120K household income.
When Closer-In Wins
Empty-nesters, urban lovers, or transit users. Downtown’s $899 starter rents convert to ownership savings, freeing cash for travel.
A Personal Note from Renee
Phoenix living pencils out beautifully when aligned with your phase—space for toddlers or buzz for adventures. No one-size-fits-all; it’s your story unfolding under our endless skies.
If you’re tallying Queen Creek vs. Quirky Central, you don’t have to figure it out alone. I’m here as your thoughtful guide, running personalized numbers and touring truths across the Valley. Reach out—let’s make the math work for your tomorrow.
Get the full Phoenix Market Insights → [Market Insights]


-
Shade Coverage and Tree Canopy Differences by Corridor
-
Summer Walkability Reality Near ASU and Mill Avenue
-
Choosing Proximity Based on Personality and Routine
-
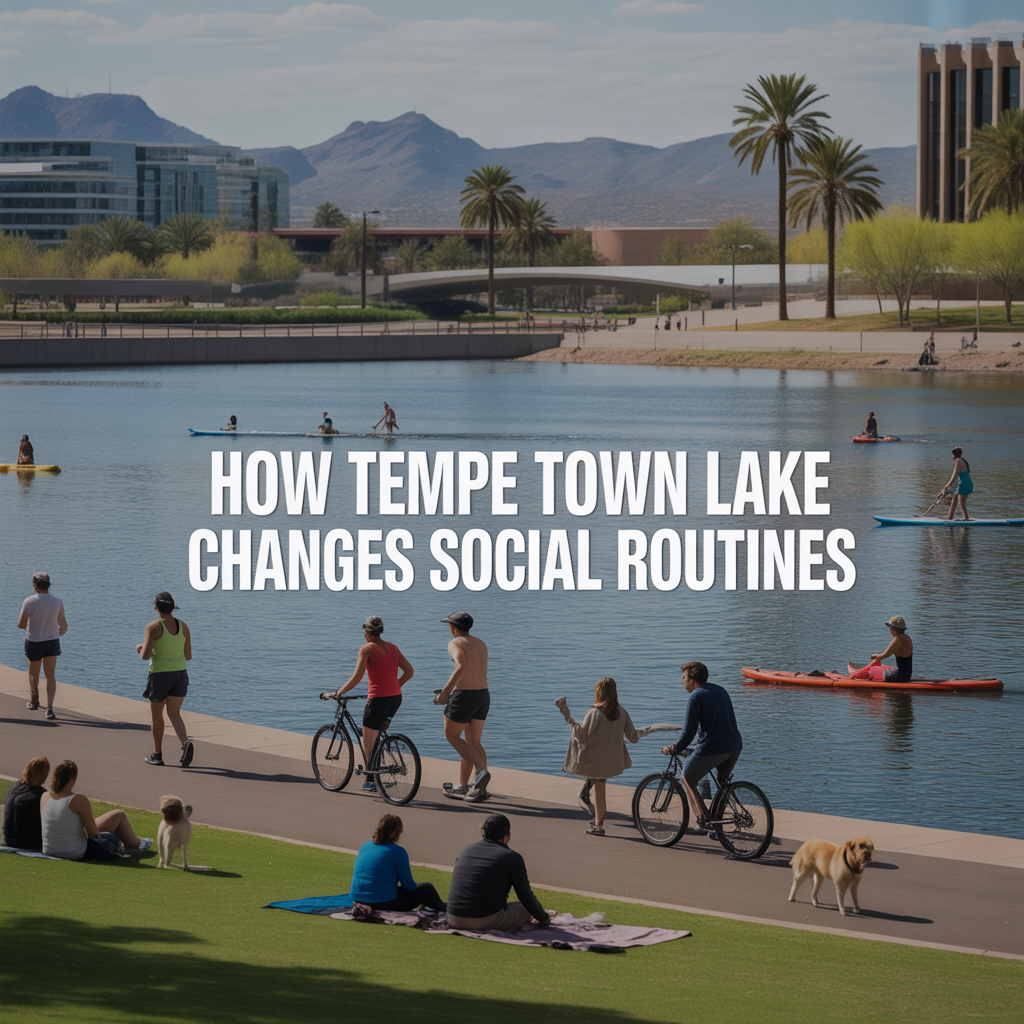
How Tempe Town Lake Changes Social Routines
-
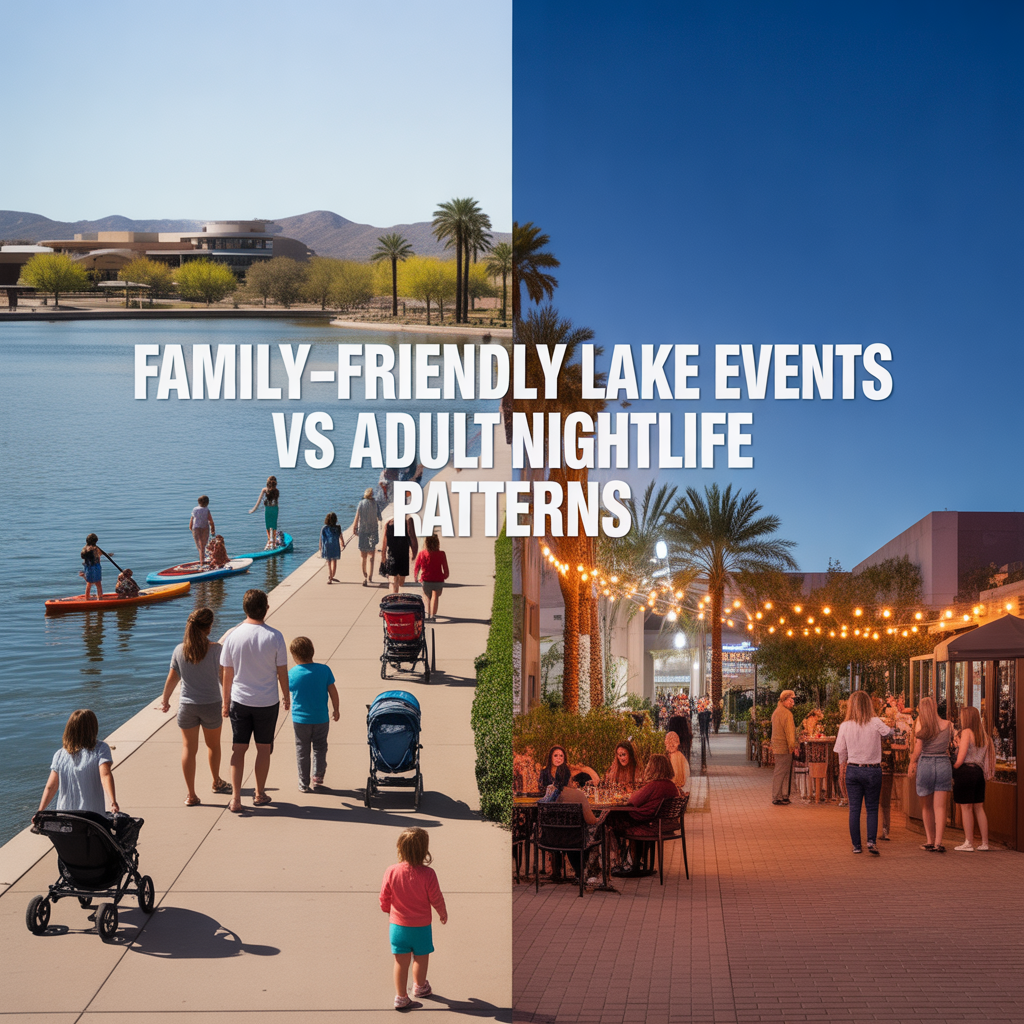
Family-Friendly Lake Events vs Adult Nightlife Patterns
-
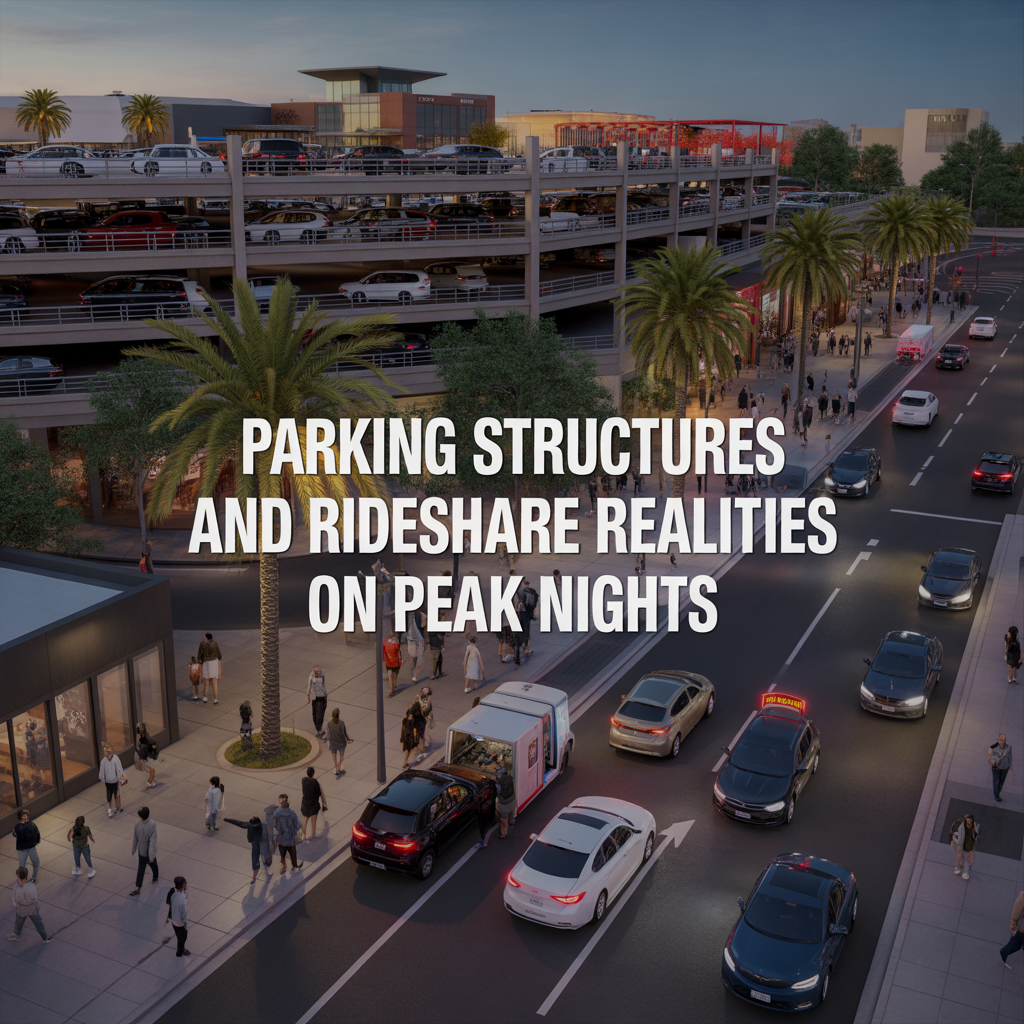
Parking Structures and Rideshare Realities on Peak Nights
-
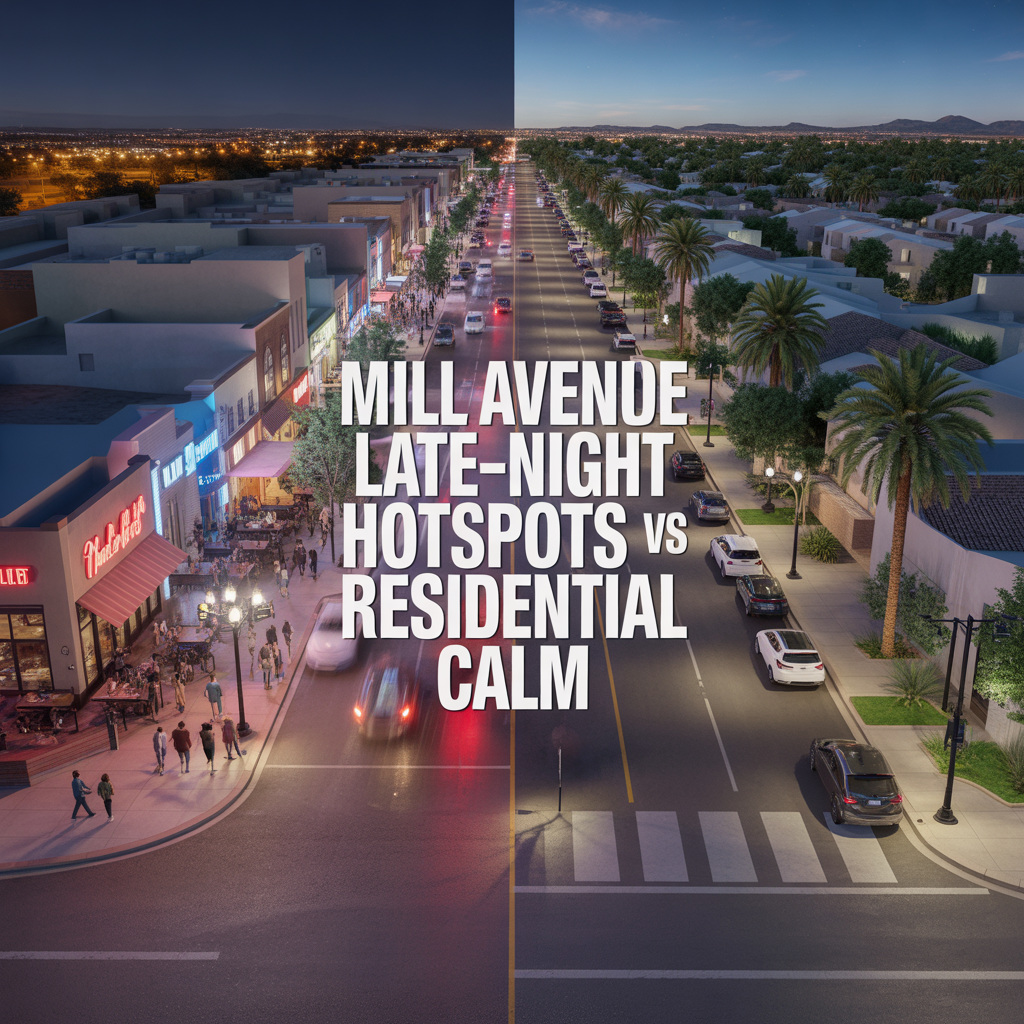
Mill Avenue Late-Night Hotspots vs Residential Calm
-

ASU Game Days and Event Calendar Impacts
-
Cross-Valley Trip Efficiency From Tempe
-
Micro-Mobility and Bike Utility by Corridor
-

Park-And-Ride, Game Day, and Event Access Patterns
-

Airport Timing Strategy Around ASU and Rush Hour Traffic
-

Light Rail Use Cases That Actually Improve Daily Life
-
Freeway vs Arterial Routing During Peak Windows
-

Real-World Drive Times to Sky Harbor From Different Tempe Pockets
-
How Traffic and Commute Direction Affect Daily Life in North vs South Tempe
-

Bike Paths, Walkability, and Short-Distance Transportation in Tempe
-

Driving Access From Tempe to Phoenix Sky Harbor Airport
-

Light Rail Access Between Tempe, Downtown Phoenix, and Mesa
-
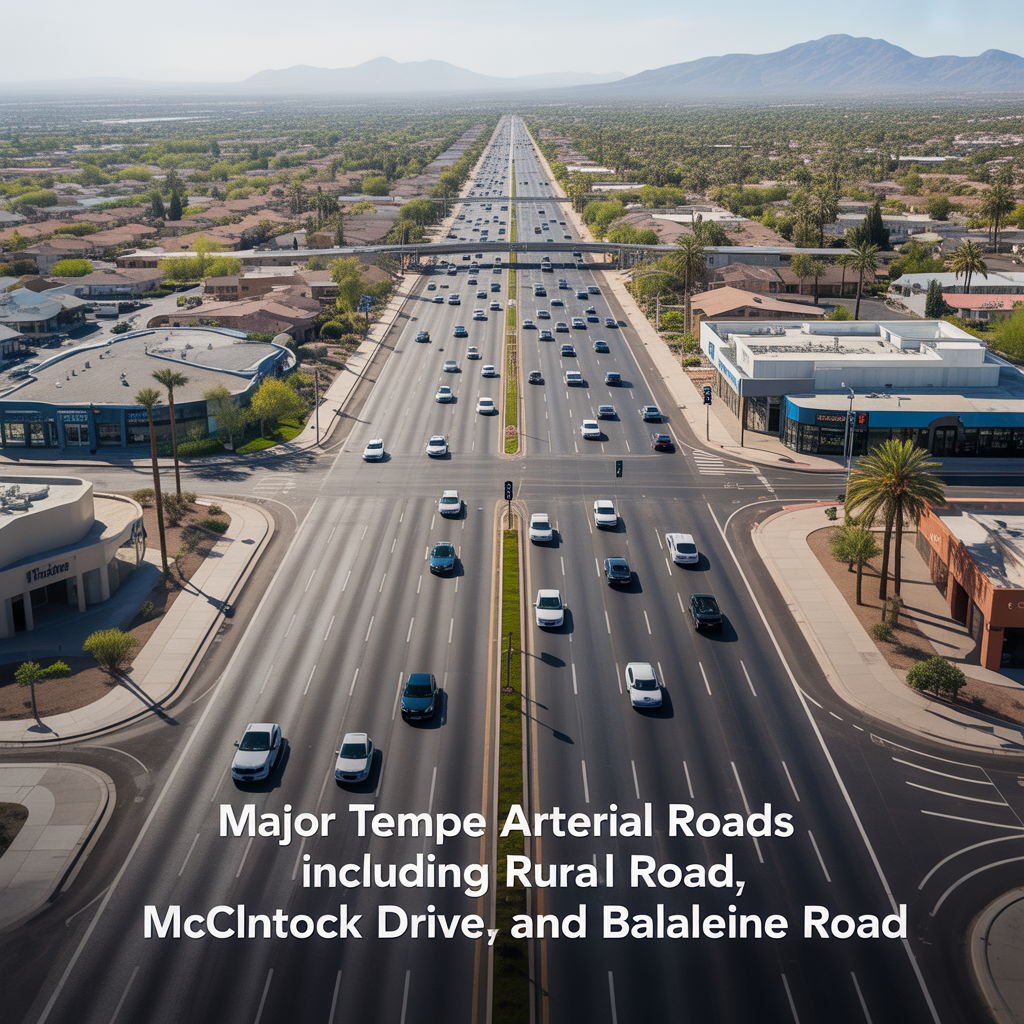
Major Tempe Arterial Roads Including Rural Road, McClintock Drive, and Baseline Road
-
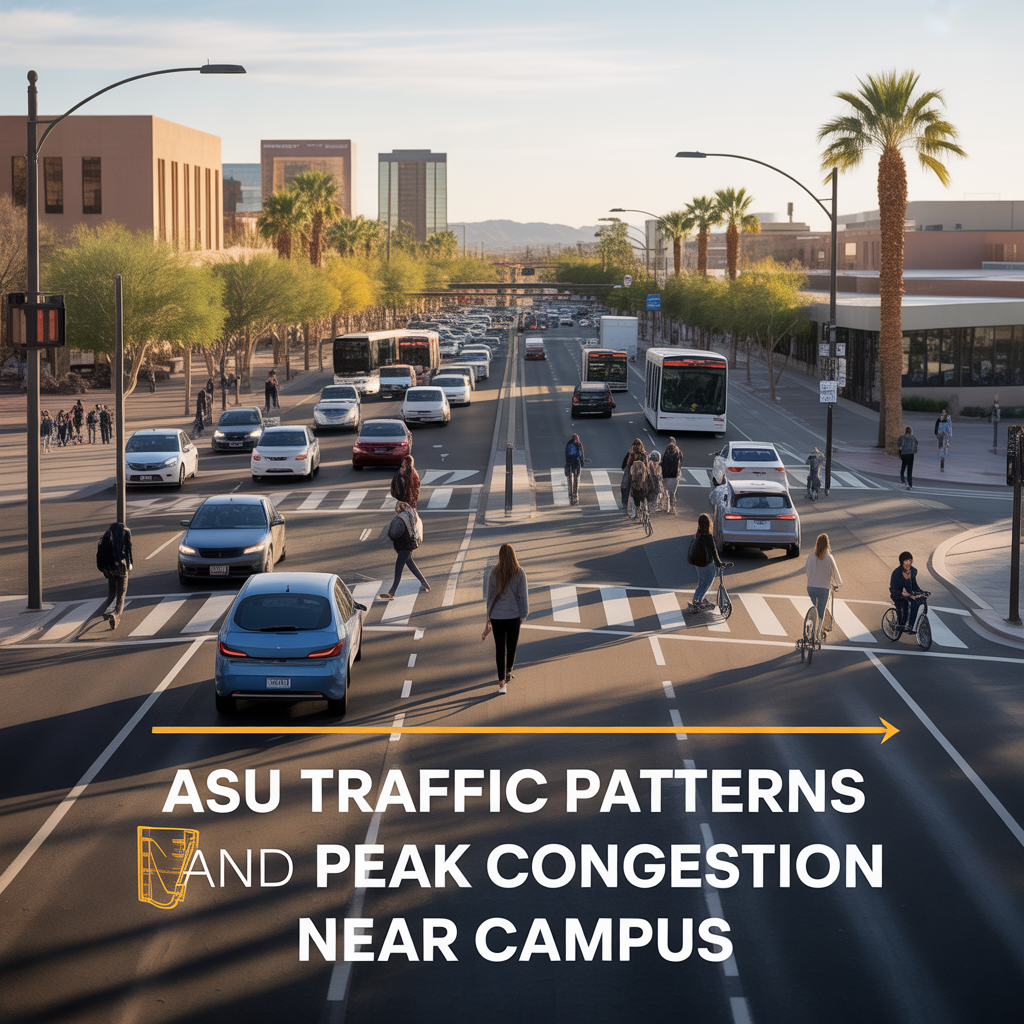
ASU Traffic Patterns and Peak Congestion Near Campus
-
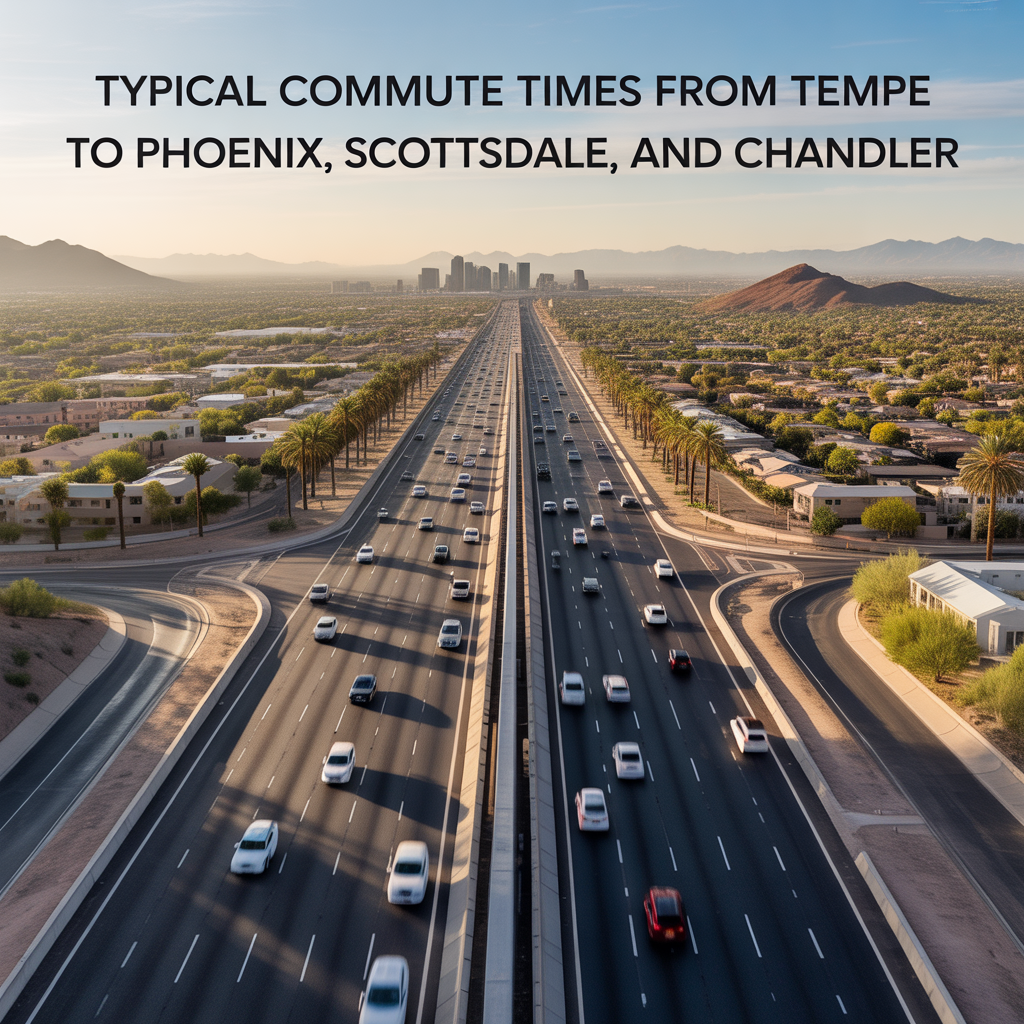
Typical Commute Times From Tempe to Phoenix, Scottsdale, and Chandler
-
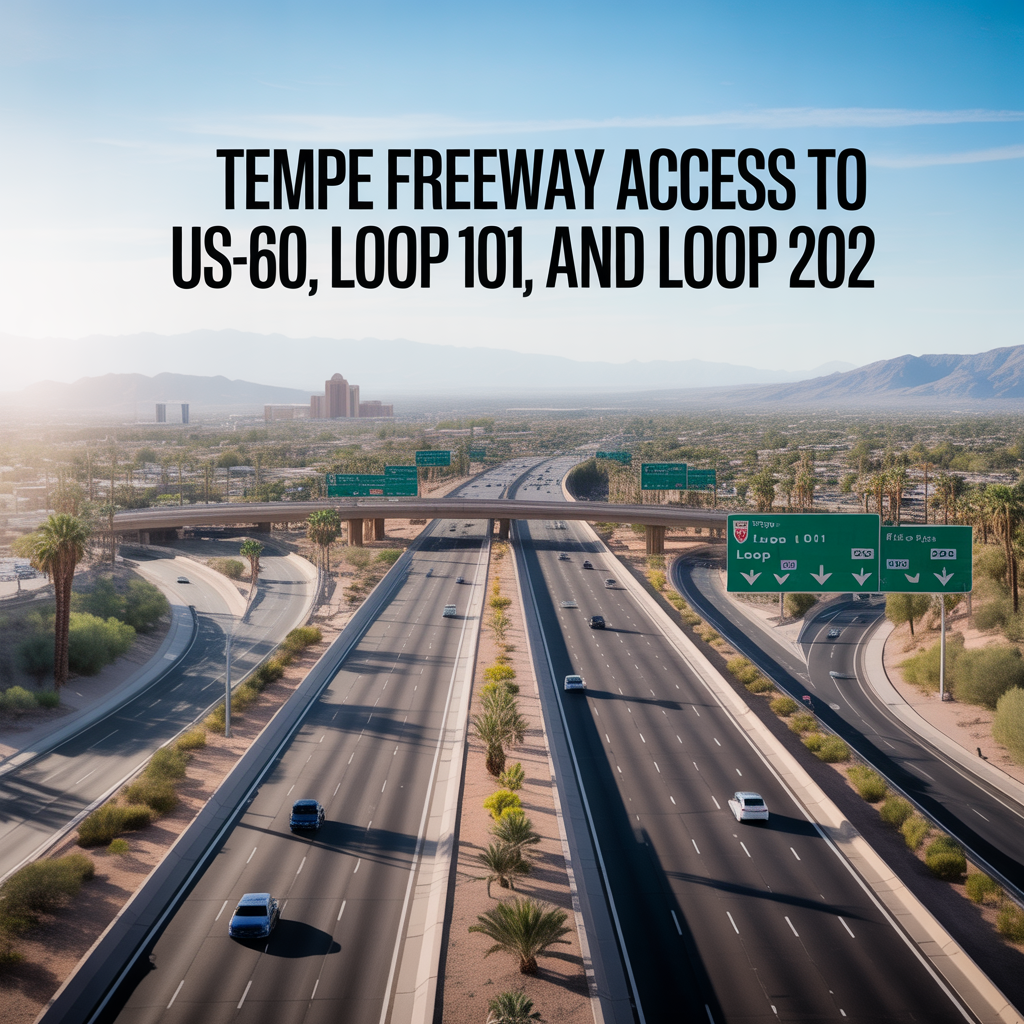
Tempe Freeway Access to US-60, Loop 101, and Loop 202
-
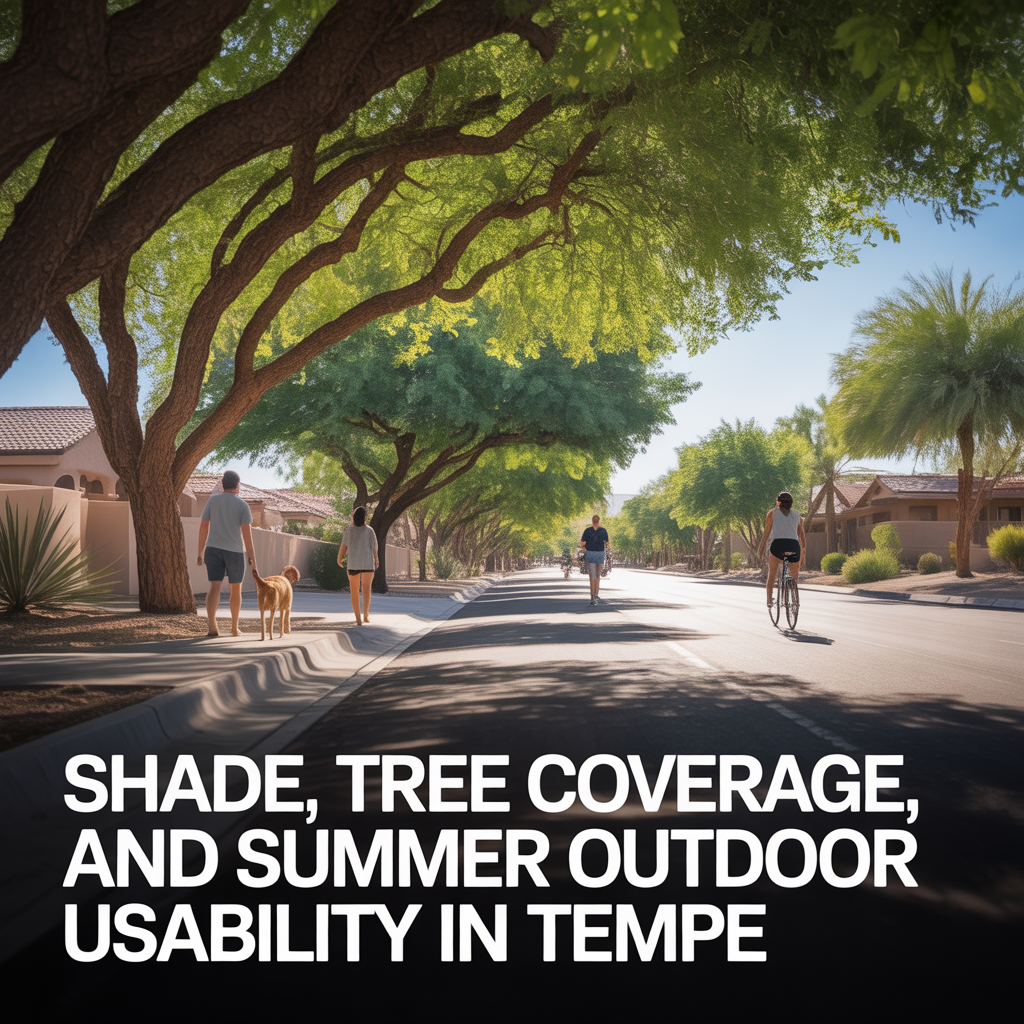
Shade, Tree Coverage, and Summer Outdoor Usability in Tempe
-
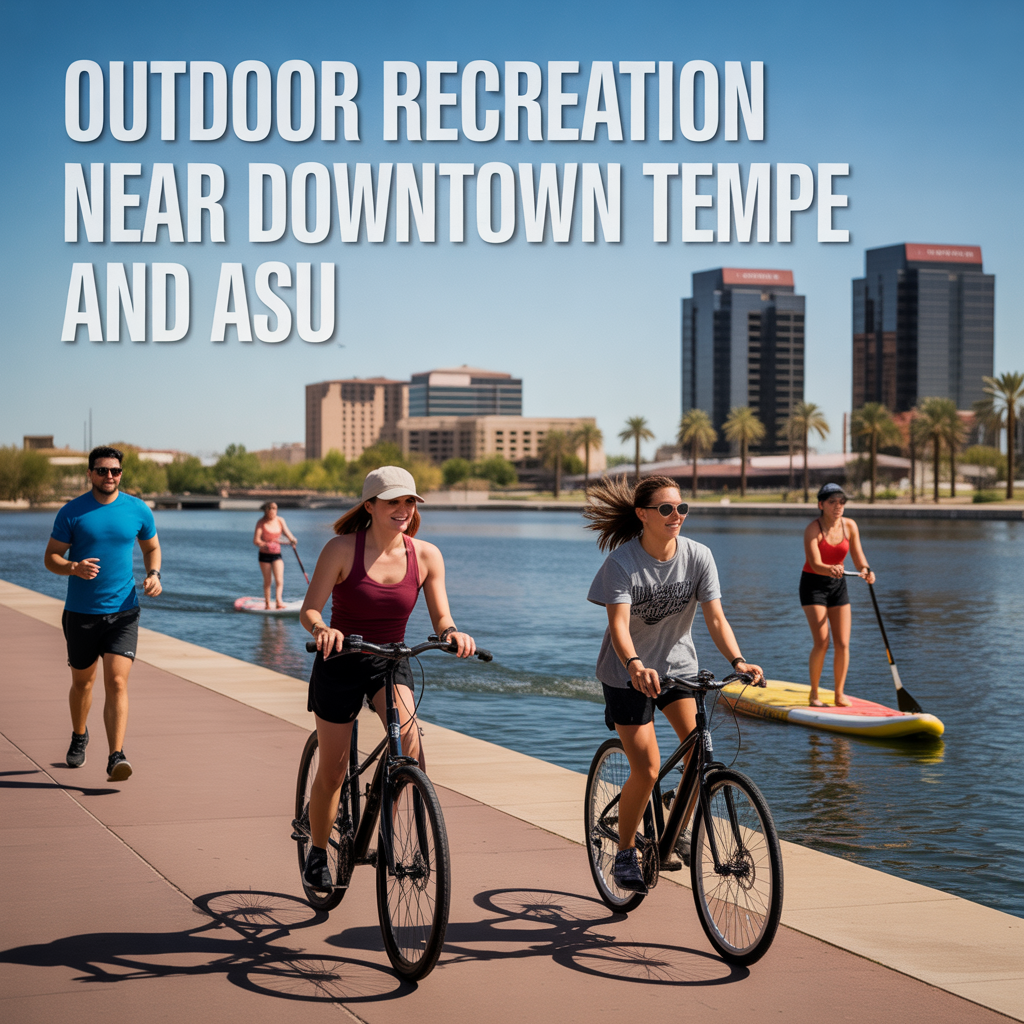
Outdoor Recreation Near Downtown Tempe and ASU