



Buyer Fears→ [Buyer Fears] & For more info on other fears Phoenix Real Estate → [Phoenix Real Estate Fears Guide]
Written by: Renee Burke
Phoenix’s housing market hums with subtle signals — inventory ticks, days-on-market shifts, price reductions that hint at seller fatigue. I track these daily, not through headlines, but raw data feeds that reveal what’s really happening neighborhood by neighborhood. This isn’t casual monitoring; it’s methodical pattern-spotting that turns numbers into actionable steps for families deciding where to plant roots in our Valley.
My Core Data Sources
I pull from multiple trusted streams to build a complete picture, cross-checking for accuracy:
- ARMLS (Arizona Regional MLS): The gold standard — real-time new listings, pendings, solds, and days on market across 40+ ZIPs. I filter by bedroom count, price band, and school zones my clients care about.
- Zillow Research and Redfin Data Center: ZHVI (Zillow Home Value Index) tracks typical values by neighborhood; Redfin’s median sale prices and offer insights show negotiation room.
- ALTEXSOFT and Cromford Report: Local deep-dives on absorption rates, seller momentum, and micro-trends like Chandler vs. North Phoenix velocity.
- FRED (St. Louis Fed): Quarterly house price indices for long-term Phoenix appreciation context.
- Public records and HOA filings: Tax rolls, permit data, and reserve studies that reveal neighborhood health beyond sales stats.
I check these morning and evening, bookmarking outliers — a Gilbert pocket with 90+ DOM suddenly, or Buckeye new builds piling up.
Key Metrics I Watch Daily
Not all numbers matter equally. Here’s my shortlist, and what they whisper:
- Months of Supply: Under 3 months screams seller’s market; 5+ favors buyers. Chandler hovers 3.5 right now; Queen Creek edges 4.2 — time to pounce on family homes there.
- Sold-to-List Ratio: 98%+ means take-it-or-leave-it pricing; under 96% opens concessions. East Valley townhomes dipping to 95% signal rate buydowns possible.
- New Listings vs. Solds (3-month rolling): When new listings outpace closes 20%+, sellers soften. We’re seeing this in North Phoenix condos post-snowbird.
- Cumulative Days on Market: Homes over 60 days often drop 3-5%; I flag these for client shortlists.
- Price Reductions: 10% of listings cutting signals softening; 20%+ means opportunity knocks.
These move before headlines catch up.
Neighborhood-Specific Tracking
Phoenix isn’t monolithic, so I drill down:
Gilbert/Chandler Cores: School-driven demand keeps velocity high. I watch Basis feeder impacts and Power Ranch absorption — when it slows, families save 2-4%.
North Phoenix: 101 corridor listings spike May-June as snowbirds test markets. DOM here predicts summer negotiation windows.
West Valley (Buckeye/Goodyear): New construction flood vs. absorption reveals builder incentives. Permitting lags signal coming supply.
Scottsdale Edges: Cash buyer ratios via sold prices; tourist rental caps affect condo velocity.
Weekly ZIP reports become client dashboards.
Interpreting for Client Life Stages
Data serves decisions, not dictates. Here’s how I translate:
| Client Type | Key Data Signals | Actionable Insight |
|---|---|---|
| Families | School ZIP months supply <4; DOM under 30 | Prioritize Gilbert now; monitor Chandler reductions |
| Retirees | 55+ community new listings up 15% | Sun Lakes summer deals incoming; negotiate HOA credits |
| Investors | Rental cap HOAs + rising vacancy signals | Mesa condos softening; cap rates improving |
| Relocators | Commute corridor pendings | North-South 101 homes holding firm — act before spring rush |
Numbers point to timing without emotion.
Micro-Trends I Spot First
- Snowbird ripple: East Valley listings jump 25% April-May as winter owners exit.
- Monsoon motivation: July DOM stretches 20% as sellers crave escape.
- TSMC effect: East Chandler inventory tightens pre-school year.
- Lock-in thaw: Rate-sensitive move-ups list when 5% mortgages hit 6.5%.
These predict pockets before they trend.
Client Deliverables: From Data to Decisions
I don’t drown clients in spreadsheets. Instead:
- Weekly dashboards: 1-page recaps with your 3 target ZIPs — supply trends, fresh reductions, motivation scores.
- Custom alerts: “Three 4-beds under $750K hit Gilbert MLS with 45+ DOM.”
- Negotiation briefs: “This pocket’s sold-list ratio at 94% — ask for $10K closing help.”
- Timeline maps: “Summer lull hits your schools zone in 60 days — prep now.”
Data becomes their calm confidence.
Why Local Tracking Beats National Noise
Wall Street reports lag; ARMLS leads. I catch Gilbert softening two weeks before Zillow posts. National “crash” talk ignores our 4-month supply stability. Phoenix cycles — snowbird, heat, school — demand daily pulse-taking.
Your Data-Driven Valley Guide
If you’re thinking about making a move in Phoenix — wanting the real-time numbers behind neighborhood shifts and timing sweet spots — you don’t have to figure it out alone. Share your price range, must-have schools, and daily commute, and I’ll pull the data that lights your path forward.
We’ll track the metrics that matter to your life, turning market hum into your family’s clear next step. Reach out when ready — clarity waits for no one, but it finds those who seek it.
Get the full Phoenix Market Insights → [Market Insights]


-

Signs Your Phoenix Roof Needs Inspection or Repair
-

How Long Tile Roofs and Roof Underlayment Last in Phoenix
-

How Smart Thermostats Improve Cooling Efficiency in Arizona Homes
-

Why AC Systems Struggle During Extreme Phoenix Heat Waves
-

How Long Air Conditioning Units Last in Phoenix Homes
-

Warning Signs Your Air Conditioner Is About to Fail
-

How Often Phoenix AC Systems Need Maintenance
-

How Irrigation System Leaks Damage Foundations and Landscaping
-

Preventing Roof Damage Before Arizona Monsoon Storms
-

Why AC Tune-Ups Are Critical for Phoenix Homes
-

What Homeowners Should Inspect Before Phoenix Summer Heat Arrives
-

Seasonal Home Maintenance Checklist for Phoenix Homeowners
-

How UV Exposure Damages Exterior Paint, Stucco, and Sealants
-

How Extreme Heat Shortens the Lifespan of Home Systems
-

Why Phoenix Roofs Wear Out Faster Than Many Other Cities
-
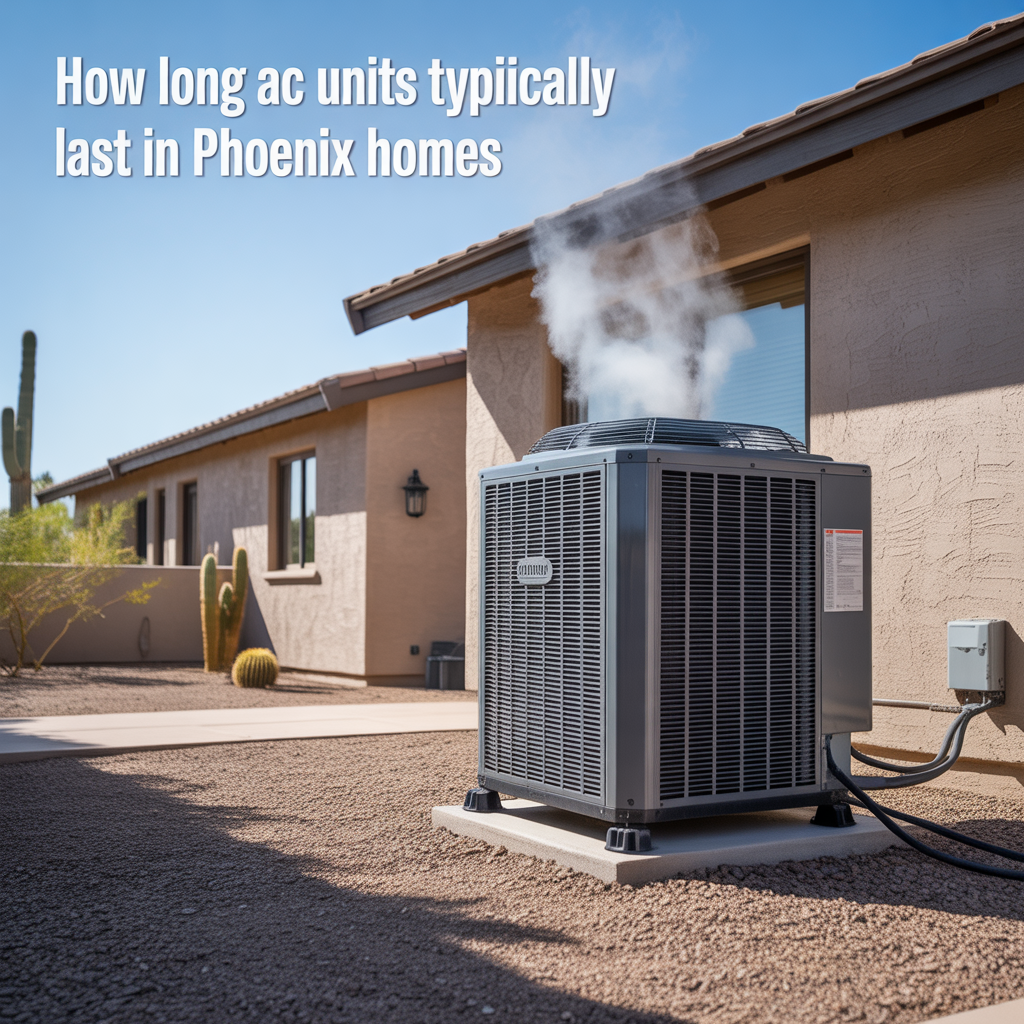
How Long AC Units Typically Last in Phoenix Homes
-

Building a Long-Term Protection Strategy
-

How Small Repairs Prevent Larger Problems
-

Protecting Older Phoenix Homes
-

Warning Signs of Hidden Home Risks
-

Preventative Maintenance That Reduces Insurance Claims
-

Reducing Liability Exposure Around Your Property
-

Liability Coverage Limits Explained
-

When Umbrella Insurance Makes Sense
-

Protecting Yourself From Guest Injury Claims