


Buyer Fears→ [Buyer Fears] & For more info on other fears Phoenix Real Estate → [Phoenix Real Estate Fears Guide]
Written by: Renee Burke
I’ve guided so many families through Phoenix’s unique selling cycles over the years, and I know how reassuring it can feel to understand the rhythm before making your move. Our Valley doesn’t follow the same script as other places — our weather, snowbird patterns, and family life create a cadence all its own, shaped by those perfect winter days and the deep summer hush.
Timing isn’t about chasing perfection; it’s about aligning with what works here, so you can sell with confidence and ease.
Winter Peak: Prime Time for Momentum (December–March)
We’re right in the heart of it now, early 2026, and this is Phoenix’s strongest selling window by far. From December through March, homes typically move in 34-42 days with sale-to-list ratios hovering at 98-99%. Snowbirds start arriving in earnest, bringing cash offers for spots in Sun City, Fountain Hills, or Ahwatukee, while local buyers plan pre-summer shifts.
February often edges out as the standout month — high demand meets milder competition before spring listings flood in. Even December holds steady with holiday relocators and early escapees from the Midwest, keeping days on market around 40 and premiums solid. For well-prepped homes, this means capturing 2-4% more equity than average, especially if your place highlights cozy patios or easy golf-course access.
Spring Surge: High Activity, Smart Pricing (April–May)
April and May keep the energy rolling as temperatures climb but stay inviting. Sales quicken to 42-48 days, with March often sparking the uptick into this vibrant stretch. Families eye moves aligned with school calendars — think Chandler districts or Gilbert’s top-rated elementaries — driving premiums up to $17,000 above norm in some pockets.
Buyers here are active but choosier with rising inventory, so presentation shines: fresh staging, pro photos catching that spring light over South Mountain. It’s a sweet spot for netting strong offers without winter’s full frenzy, ideal if your timeline fits a quick close before June heat.
Summer Slowdown: Proceed with Caution (June–August)
Here’s where I advise the most patience — June through August is our quietest, longest stretch, with days on market stretching to 54-67 and ratios dipping to 96-97%. Triple-digit days starting in June send showings plummeting; out-of-towners pause, and locals focus on vacations or AC-cooled living.
July and August lag furthest, potentially costing $7,500-$15,000 less on a $500k sale compared to peaks. That said, move-in-ready homes with pools or east-facing orientations can still draw committed locals in Mesa or Peoria. If your life calls for summer, we lean into cooling features and aggressive value pricing.
Fall Build-Up: Underrated Opportunity (September–November)
September eases the heat, and by October-November, we see a gentle rebound — 43-58 days on market, ratios at 97-98%. Early snowbirds scout ahead, blending with locals repositioning before holidays, like upgrades in Desert Ridge or downsizes in Litchfield Park.
November’s lower listing volume gives your home breathing room to stand out, setting up Q1 momentum without peak-season rush. It’s strategic for sellers prepping updates, offering motivated buyers and solid proceeds.
Neighborhood Rhythms: It’s Hyper-Local
Phoenix’s sprawl means seasonality varies — East Valley like Queen Creek peaks winter-spring for families; West Valley (Goodyear, Surprise) hums with retirees year-round but surges with snowbirds. Arcadia or Central Phoenix holds steadier, less heat-sensitive, while Scottsdale luxury paces itself across seasons.
Your block’s perks — trails near Papago, dining off Scottsdale Road — amplify these pulls. A 1990s Tempe charmer might zip in February; Paradise Valley estates take a steadier path.
Layering Lifestyle and Prep
Data guides us, but Phoenix sales thrive on feel: showcase winter-ready yards, summer-smart cooling, those endless sunny vibes. Prep early — xeriscape the curb, stage for flow — and price true to comps. Post-2021 equity gives breathing room across cycles.
Your Timeline Comes First
These patterns inform, but your needs lead — outgrowing a starter in Verrado? Craving a single-story in Fountain Hills? We sync market pulse to your story for the right fit.
Ready to Chart Your Season?
If Phoenix’s cycles have you pondering a list — be it February fire or November calm — let’s talk it through. You don’t have to sort it alone; I know our Valley’s heartbeat and can help tune it to yours.
Drop me a line for a gentle review of your home, local trends, or game plan. Together, we’ll find the rhythm that moves you forward with quiet confidence.
Get the full Phoenix Market Insights → [Market Insights]

-

How the Phoenix Desert Climate Shapes Everyday Life Inside the Home
-

How Phoenix Weather Patterns Shape Everyday Home Routines
-

Why Homes Often Feel More Comfortable After the First Year of Ownership
-

How Living in Phoenix Changes the Way Homeowners Use Their Homes
-
What New Phoenix Homeowners Learn During Their First Year of Ownership
-

How Daily Life Changes After the First Year of Living in a Phoenix Home
-
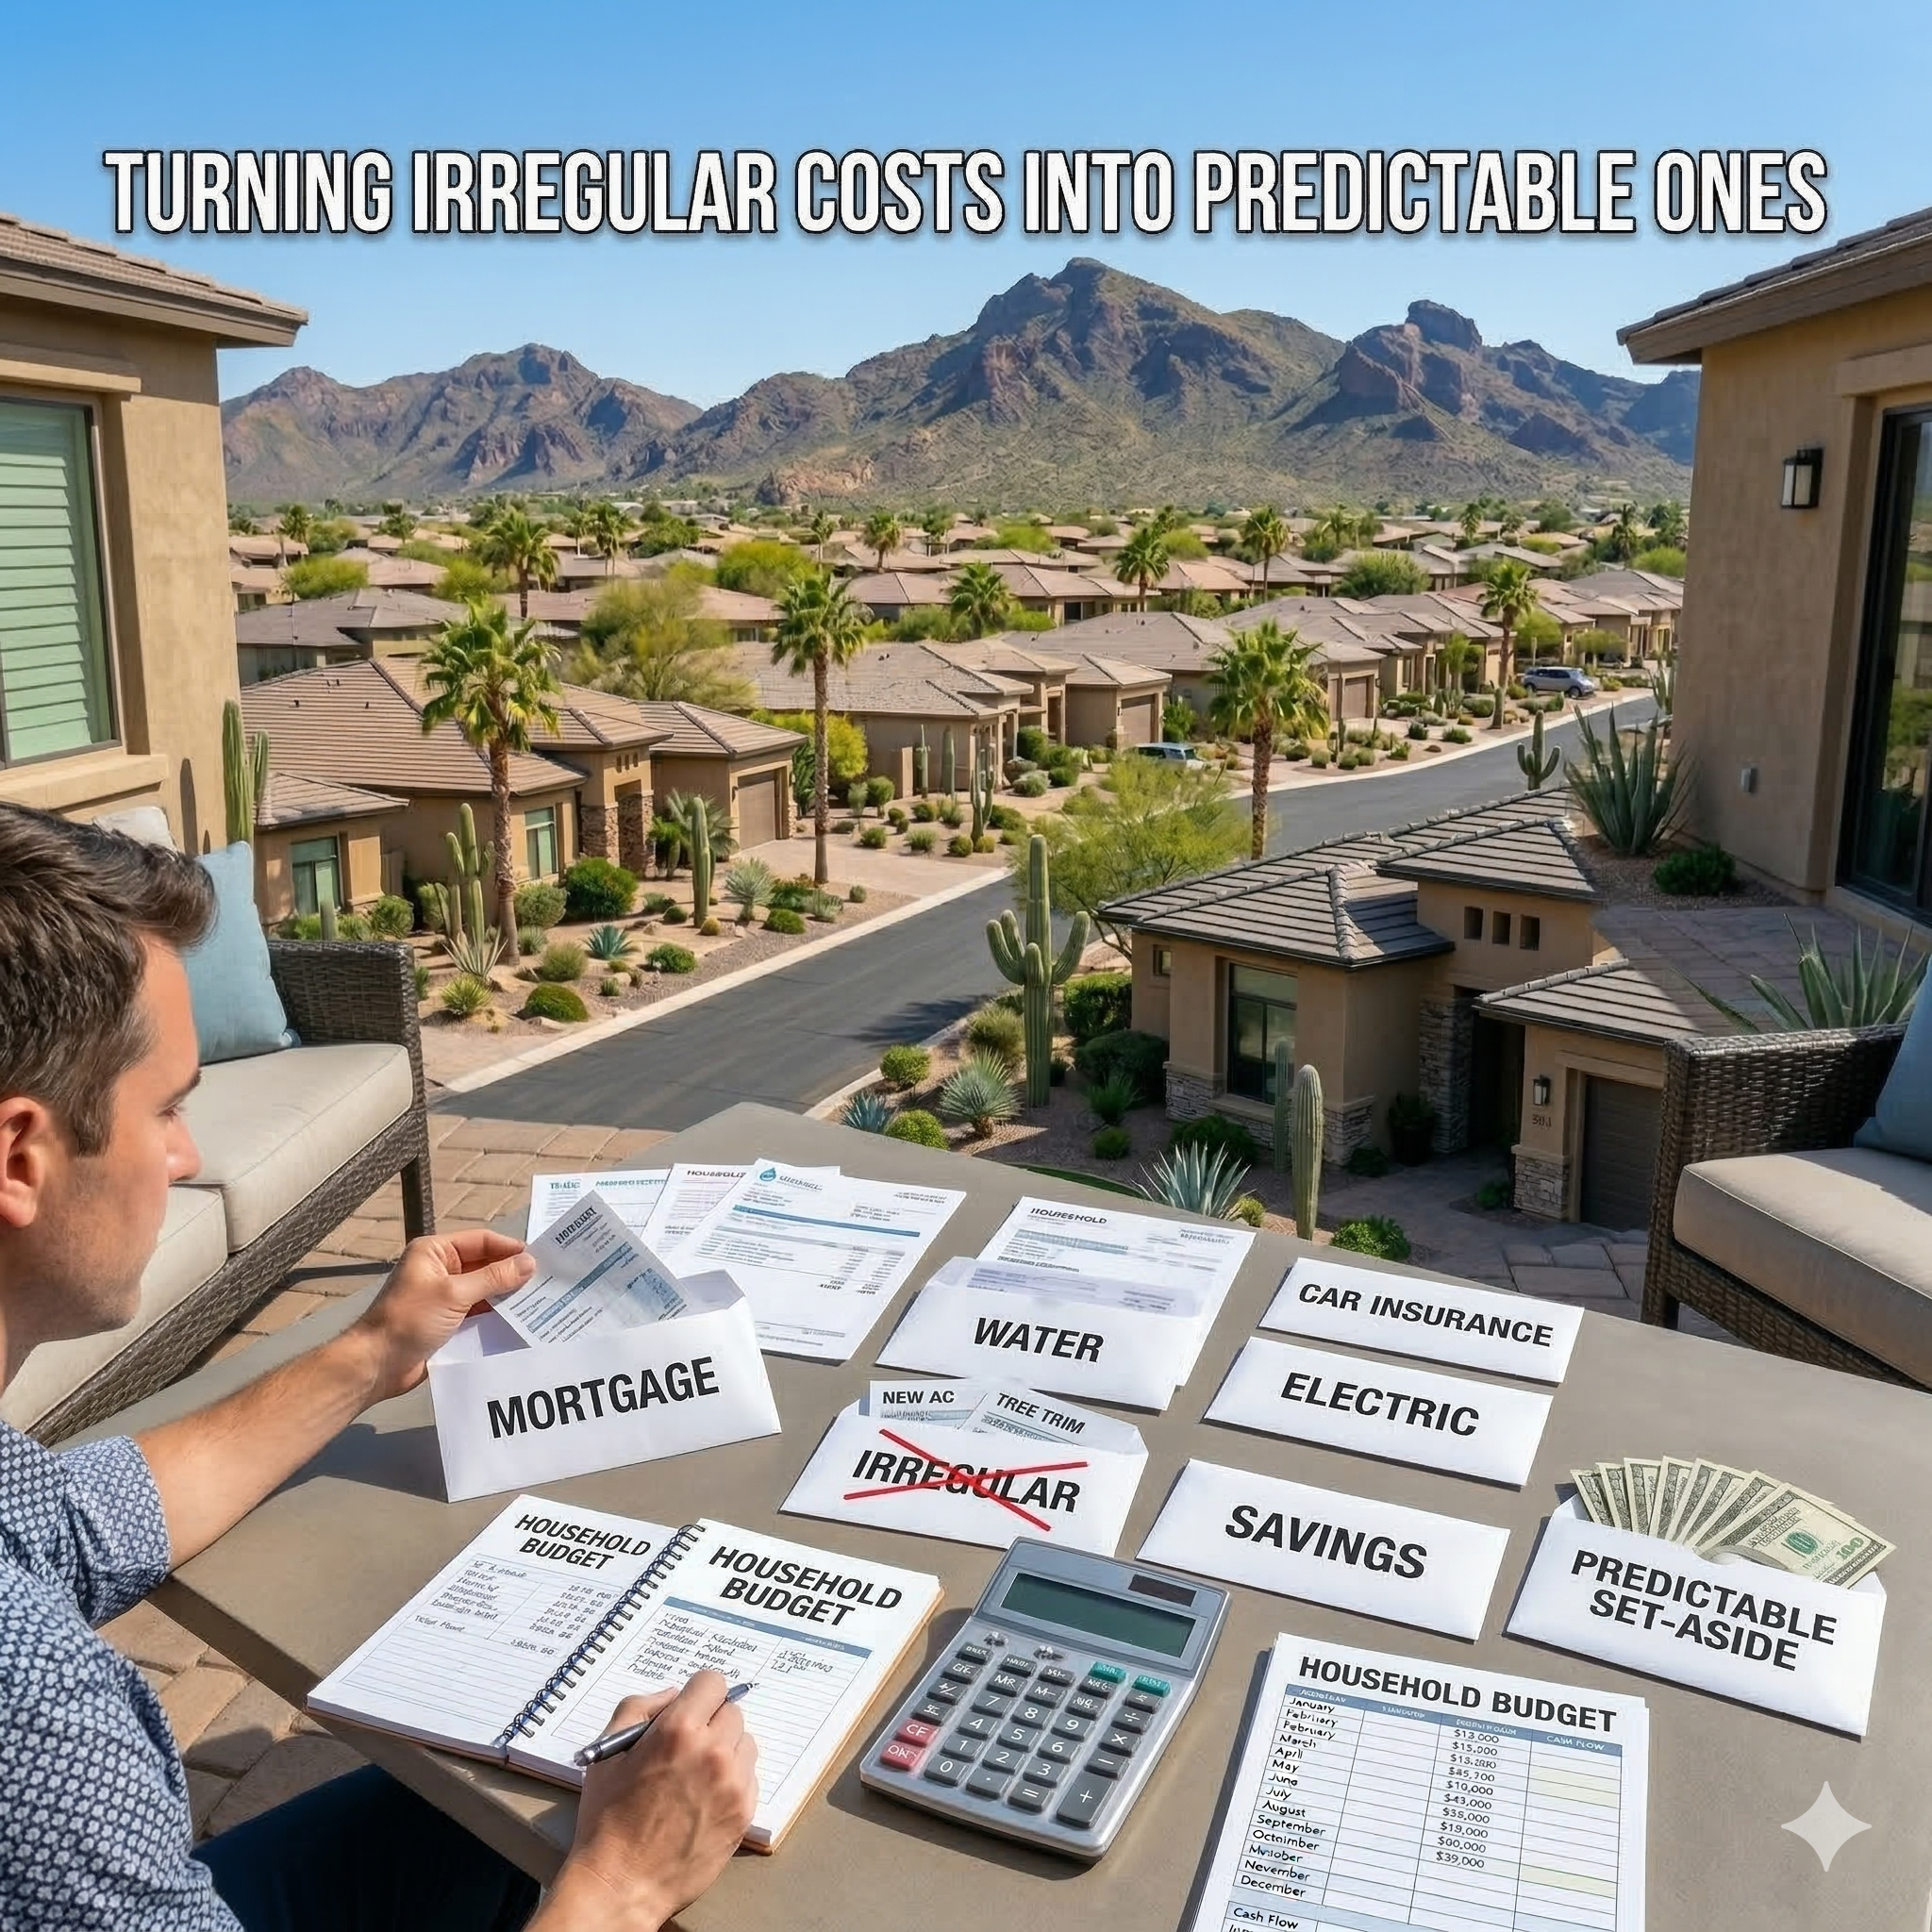
Turning Irregular Costs Into Predictable Ones
-

Budgeting for Ongoing Ownership
-

Repair vs Replace vs Defer Decisions
-

Planning Homeownership Like a Long-Term Asset
-

What Home Expenses You Can Safely Delay
-

Stopping Cost Creep Early
-

Cash Flow vs Net Worth Stress
-
Why “It’s Not That Much” Adds Up
-

Warning Signs Your Ownership Budget Is Tightening
-

The Cumulative Cost of Small Home Repairs
-
Designing Budgets Around Local Conditions
-
Utility Costs Over Time in Desert Climates
-

Insurance Increases Explained for Arizona Homeowners
-
How Inflation Impacts Phoenix Homeownership Costs
-

Avoiding Debt-Driven Homeownership Decisions
-

Replacing Systems on Your Timeline
-

Why Emergency Repairs Cost More
-

Timing Major Expenses Without Financial Shock
-
How Much to Keep in a Phoenix Home Reserve Fund