


Buyer Fears→ [Buyer Fears] & For more info on other fears Phoenix Real Estate → [Phoenix Real Estate Fears Guide]
Written by: Renee Burke
Phoenix sellers often wonder: at what point does the market move against my list price? The good news is that Phoenix’s current stability means your price has more breathing room than you might fear—significant shifts would need to happen before it truly becomes a problem.
Phoenix’s Current Price Cushion
Right now, our market is in a recalibration phase—inventory up modestly from pandemic lows, sales steadying, and prices holding firm in most segments. Well-priced homes still sell predictably, often within 30–60 days, while overpriced ones linger and adjust. This gives sellers a buffer: your list price can withstand small ripples without derailing your sale.
The key threshold? A shift severe enough to flip buyer psychology from “cautious but active” to “pulling back entirely.” That doesn’t happen overnight in Phoenix, thanks to our job growth, migration draw, and persistent supply constraints.
Threshold 1: Inventory Doubles Rapidly
Your list price starts feeling pressure when active listings jump dramatically—say, 50–100% higher than today’s levels, far beyond the 12–25% year-over-year increases we’re seeing now.
How far is that?
- Current: Listings are up but still tight compared to pre-2020 norms.
- Problem zone: 8,000–10,000+ active single-family listings Valley-wide (versus ~4,000–5,000 recently).
What it would take: A sudden wave of “lock-in effect” sellers hitting the market at once—homeowners ditching sub-4% rates en masse after a big rate drop, or economic anxiety prompting a sell-off. Unlikely without a recession deeper than 2008, which experts don’t foresee here.
Seller impact: Showings drop 30–50%, feedback turns picky, and price reductions become routine (already at 28% of listings). Your home would need standout condition to compete.
Threshold 2: Days on Market Balloon to 90+
Phoenix homes currently average 50–70 days on market for well-priced properties. Your list price holds strong up to about 75–90 days—beyond that, it risks feeling “stale” to buyers scanning fresh listings.
How far is that?
- Trigger: Valley median DOM hits 90–120 days consistently for 2–3 months.
- Current buffer: Overpriced listings already average 67 days versus 28 for spot-on pricing.
What it would take:
- Mortgage rates spiking back to 7.5%+ and staying there, crushing affordability (a 0.5% rise already cuts purchasing power by ~$30K at median prices).
- Job losses in key sectors like semiconductors or healthcare, slowing transplants.
Seller impact: Buyers assume problems with long-listed homes, mentally discounting 3–5% off your price. Negotiations shift heavily toward concessions.
Threshold 3: Median Prices Drop 5–7% Valley-Wide
Phoenix prices have softened 2–3% in some segments from peaks but stabilized overall. Your list price becomes vulnerable at a sustained 5–7% drop in your neighborhood’s median—enough to make buyers wait for “better deals.”
What it would take:
- National recession hitting Phoenix’s growth engines (unlikely given our outpacing GDP).
- Builder oversupply flooding entry-level with incentives resales can’t match.
Seller impact: Comp pressure forces 5–10% cuts if you’re at the high end of your range. Mid-tier family homes feel it first; luxury holds longer.
Threshold 4: Buyer Traffic Dries Up 20–30%
The real killer for list prices is low activity. Phoenix buyers are rate-sensitive but returning as rates stabilize in the low 6s. A 20–30% drop in showings or contracts signals trouble.
How far is that?
- Current: Steady traffic for priced-right homes; best properties still move fast.
- Problem: Pending sales fall 20%+ below seasonal norms for 90+ days.
What it would take: Election fallout, stock market plunge (hurting high-end), or inflation reigniting rate hikes.
Seller impact: You’d face “let’s see what happens” feedback, mounting carrying costs, and pressure to slash aggressively.
Why Phoenix Won’t Hit These Thresholds Soon
Our fundamentals are solid: supply deficits persist, jobs draw relocators, and 80% of owners are rate-locked. Even in cool-downs, Phoenix avoids crashes—think measured corrections, not cliffs.
Most sellers’ list prices are safe unless multiple thresholds hit together (e.g., rates + jobs). Single factors alone? Manageable with tweaks.
Realistic Pressure Points (and Fixes)
Even short of catastrophe, watch these early warnings:
- Neighborhood comps softening 3%: Reposition 2–4% proactively.
- DOM past 45 days: Refresh photos, host broker open, consider $5K–10K drop.
- Price cuts nearby: Analyze why—condition or pricing?—and adjust accordingly.
Smart sellers build in 3–5% flex from day one, treating it as strategy, not failure.
A Warm Next Step
Phoenix’s market gives your list price real resilience—far more than headlines imply. But every home is unique, and knowing your exact buffer comes from mapping your specifics against today’s data.
If you’re listing soon or already have, let’s look at your numbers together—no hype, just a clear-eyed view of how much shift it would take to pressure your price, and exactly what to watch. You don’t have to guess or wait for trouble. Reach out when you’re ready—I’m here to steady the path ahead, one thoughtful step at a time.
Get the full Phoenix Market Insights → [Market Insights]

-
Cost of Living in Rhode Island: Housing, Taxes, Utilities, and Everyday Expenses
-

What If My Commute Becomes Worse Than Expected?
-

How Aging Home Systems Affect Property Value
-

Energy Efficiency Upgrades for Phoenix Homes
-
How to Plan for Major Home System Replacements
-

When Phoenix Homeowners Should Replace Water Heaters
-

Repair vs Replace Decisions for Phoenix HVAC Systems
-
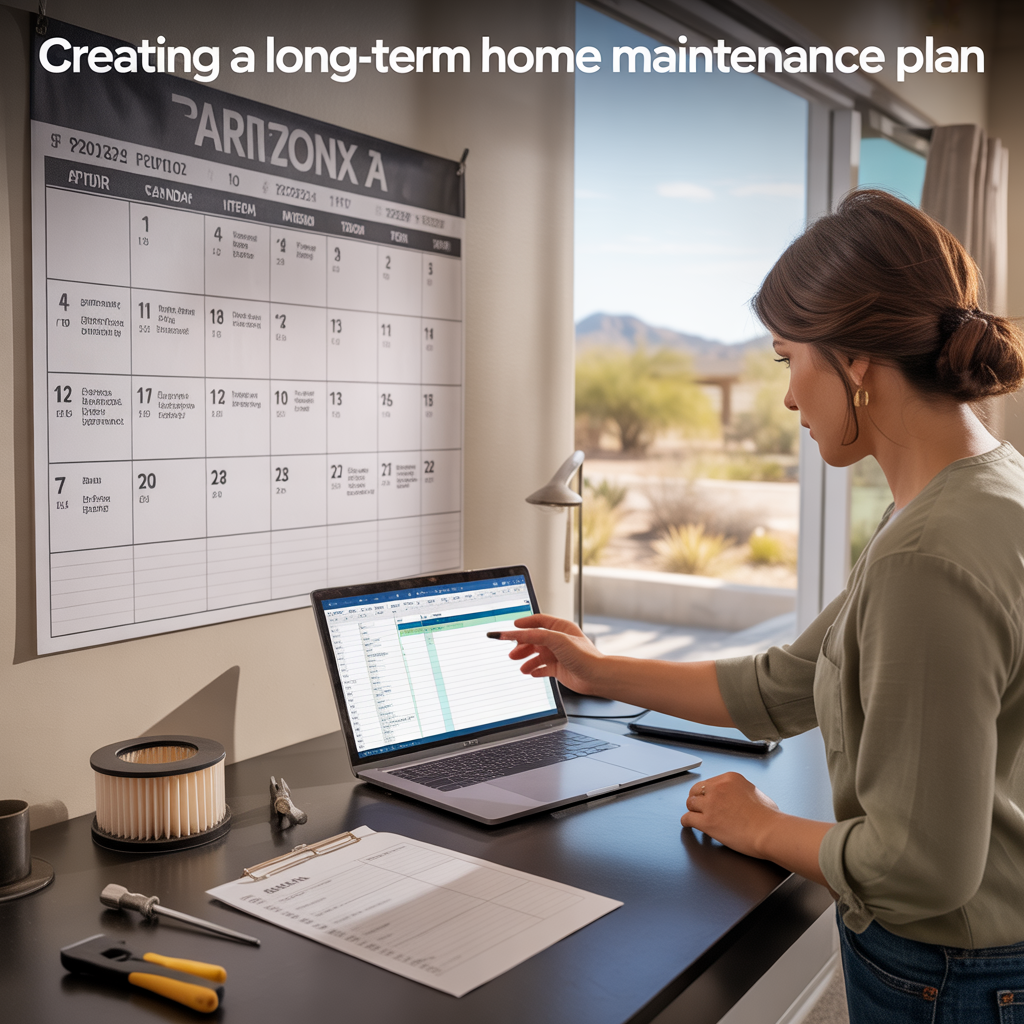
Creating a Long-Term Home Maintenance Plan
-
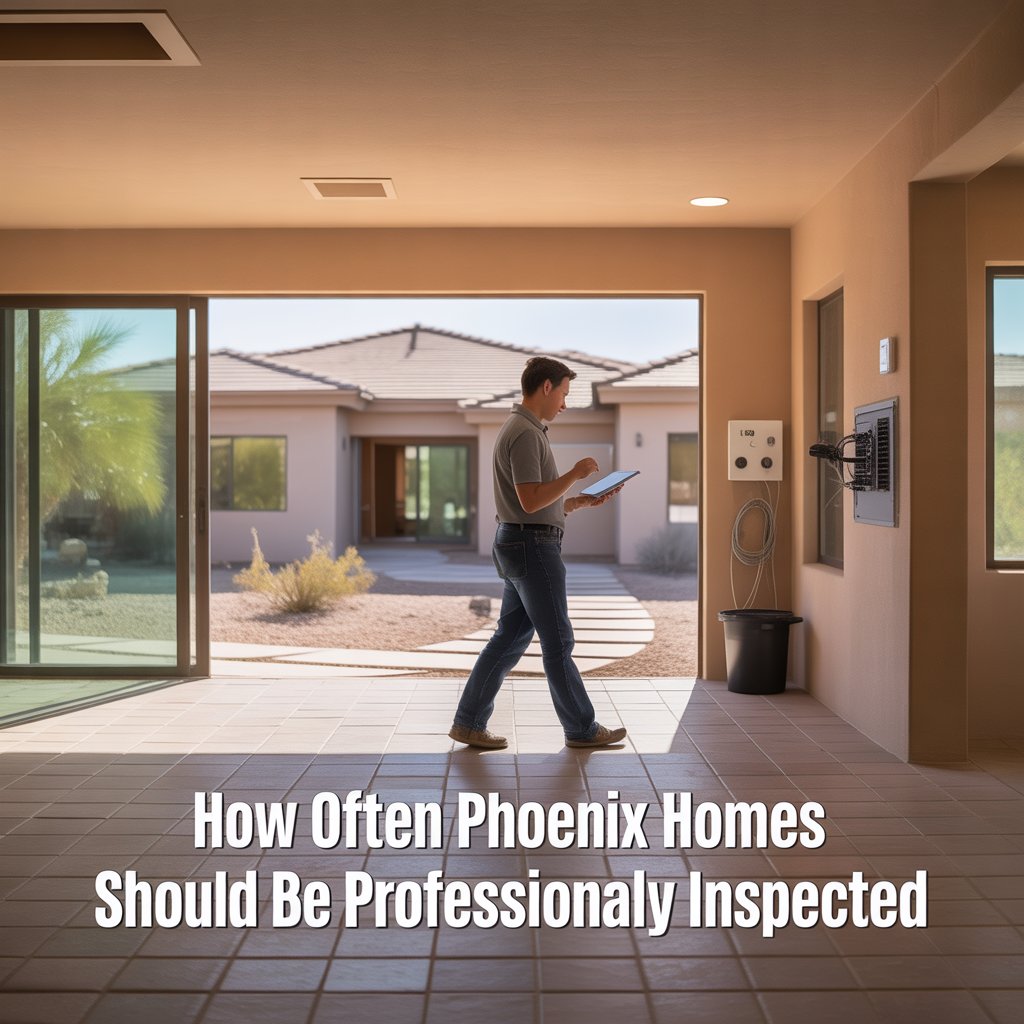
How Often Phoenix Homes Should Be Professionally Inspected
-
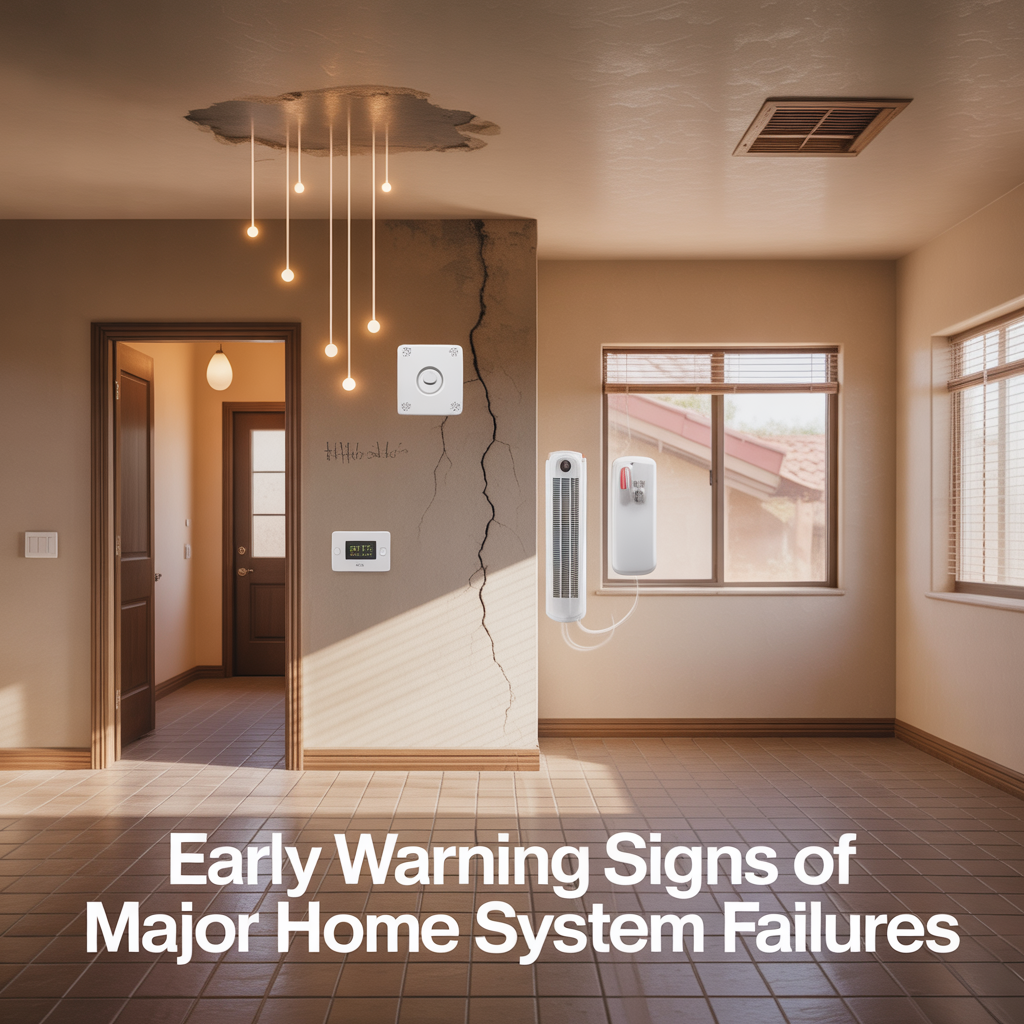
Early Warning Signs of Major Home System Failures
-

How Preventative Maintenance Protects Phoenix Property Value
-

The Best Annual Home Maintenance Plan for Phoenix Homes
-

Electrical Safety Inspections for Older Phoenix Homes
-
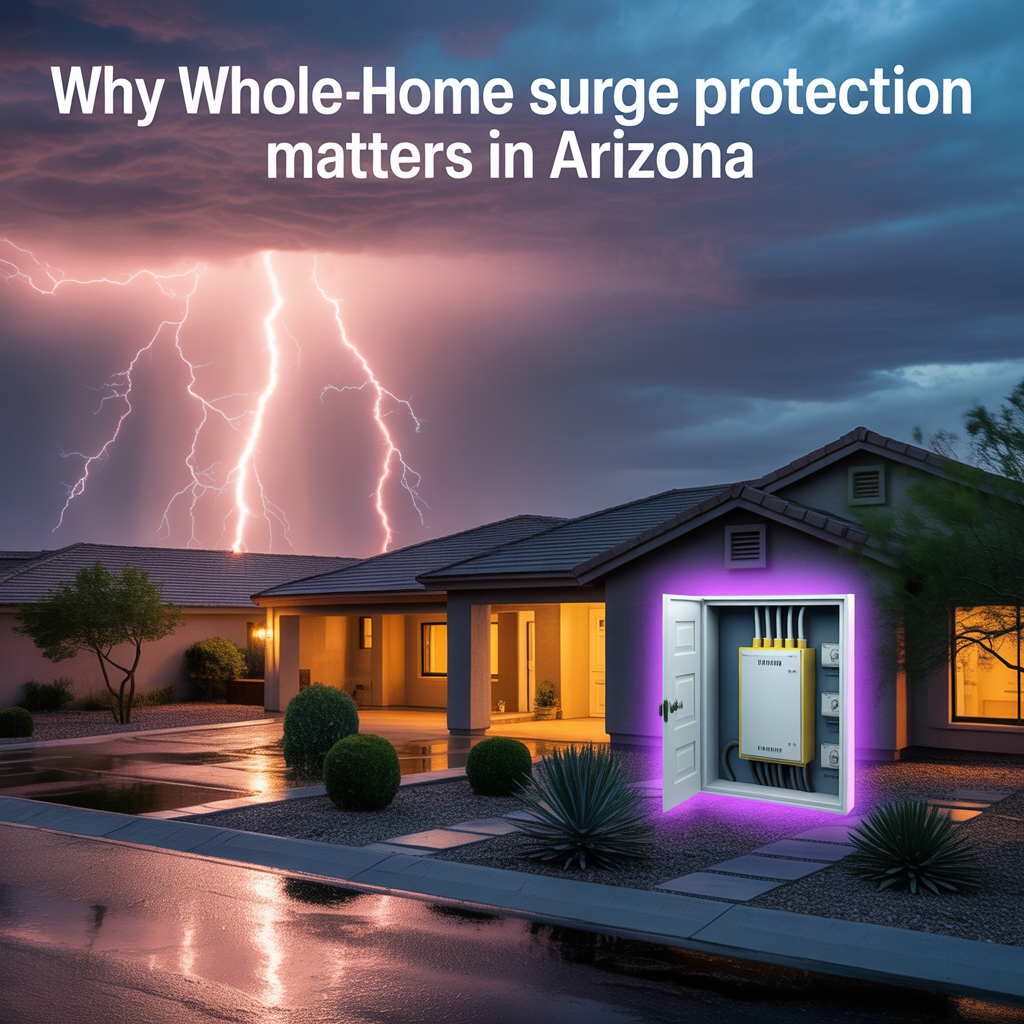
Why Whole-Home Surge Protection Matters in Arizona
-

Preparing a Phoenix Home for Electric Vehicle Charging
-

Signs Your Home’s Electrical System Is Overloaded
-
When Phoenix Homes Need Electrical Panel Upgrades
-

Water Pressure Problems in Phoenix Homes Explained
-

Preventing Irrigation Leaks That Waste Water in Desert Landscapes
-

Signs of Hidden Plumbing Leaks in Phoenix Houses
-

How Long Water Heaters Last in Arizona Homes
-

How Hard Water Affects Plumbing Systems in Phoenix Homes
-

Preventing Water Damage in Phoenix Homes During Storms
-

Roof Maintenance Tips Before Phoenix Monsoon Season
-
How Arizona Sun Damages Roofing Materials Over Time