


This guide is part of our Current Real Estate Market Insights → [Current Real Estate Market Insights]
Written by: Renee Burke
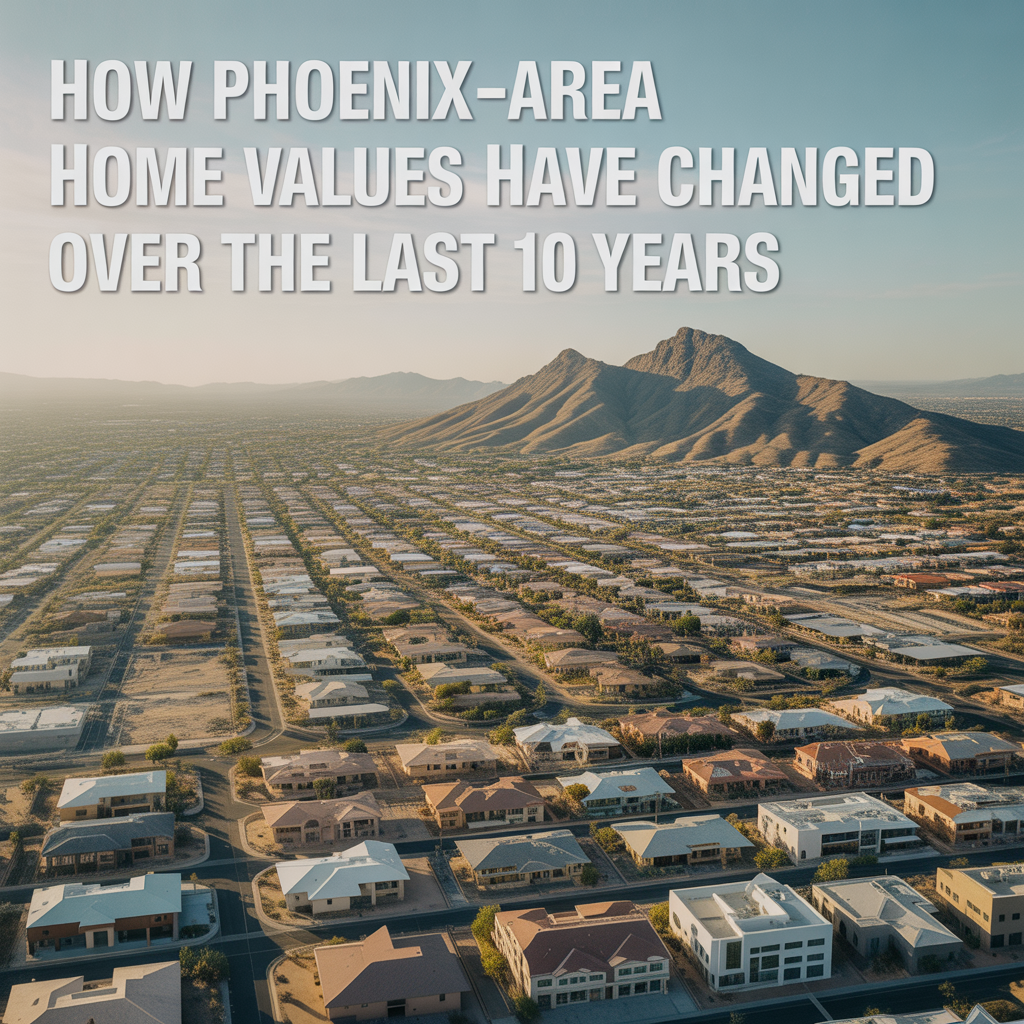
If you’ve owned a home in the Valley for a decade, you’ve ridden one of the most remarkable growth stories in American real estate. From the steady climb out of the Great Recession to the pandemic surge and now a more measured stabilization, Phoenix-area values have more than doubled since 2016 — reflecting our job boom, sunshine appeal, and that undeniable draw of desert living.
I remember walking clients through early listings when $250,000 felt like a stretch for a solid Chandler single-family. Today, that same neighborhood commands nearly $500,000. These shifts aren’t just numbers; they mirror how families have planted roots, tech jobs at Intel and TSMC reshaped commutes, and retirees found their forever golf homes. Let’s trace the journey year by year, with context on what drove each leg, so you can see where we’ve been — and what it means for your next chapter.
The Recovery Years: 2016-2019
Back in 2016, the Phoenix metro median home price hovered around $225,000-$240,000 for single-family homes. We were still shaking off recession shadows, but inventory was tight, and cash buyers from California snapped up fixer-uppers in Mesa and Glendale. Steady job growth in healthcare and manufacturing laid the foundation.
By 2017, values climbed to $260,000-$275,000, a solid 15-20% jump. Families returned to Gilbert’s top schools, drawn by Intel’s Chandler expansions. 2018 pushed medians to $295,000-$310,000 as low rates (under 4.5%) fueled first-time buyers near Tempe’s Mill Avenue.
2019 marked $320,000-$335,000 Valley-wide — about 40% growth from 2016. Phoenix proper saw Arcadia gems rise fastest, while outer areas like Buckeye offered entry points. Concerns about overbuilding faded as demand outpaced supply.
Pandemic Boom: 2020-2022
Then came 2020: medians leaped to $350,000-$375,000, up 15% in months. Remote work sent Californians to Queen Creek lots; low rates (2.5-3%) and stimulus checks accelerated flips in West Valley suburbs.
2021 was explosive — $425,000-$460,000 medians, a 25-30% surge. Cash flooded in; bidding wars hit 20+ offers on Chandler pools. By 2022, peaks reached $480,000-$515,000. Scottsdale luxury soared, but even Peoria townhomes doubled from 2016. Pandemic fears of tight cities drove this; our wide-open spaces and 300 sunny days sealed it.
Over five years, values roughly doubled — from $240K to $480K — turning modest equity into life-changing wealth for long-timers.
The Reset: 2023-2026
Rates spiked to 7%+ in 2023, cooling medians to $460,000-$485,000 (down 5-8% from peaks). Inventory ticked up, giving buyers breathing room in Surprise new builds. 2024 stabilized at $470,000-$495,000 as TSMC fabs promised jobs.
Into 2025-2026, we sit at $435,000-$489,000 medians — down 2-5% year-over-year but up 80-100% from 2016. January 2026 data shows Phoenix proper at $458,000 median sold (from $485K prior year), averages $670K, and listings at $489K. Zillow pegs typical values at $404K, reflecting softer segments.
Suburb Spotlights: Uneven Gains
Growth wasn’t uniform — lifestyle and jobs dictated paces:
- Chandler/Gilbert: 2016 ~$280K to 2026 ~$550K-$620K (+110%). Tech corridor gold.
- Phoenix Proper: $210K to $450K-$670K avg (+115%). Urban renewal.
- Mesa: $200K to $450K (+125%). Retiree value.
- West Valley (Buckeye): $180K to $400K (+120%). New builds.
- Scottsdale: $400K to $900K+ (+125%). Luxury pull.
Outer suburbs gained most percentage-wise; core areas added raw dollars.
What Fueled the Decade-Long Rise
Phoenix’s story blends macro and micro:
- Migration: 50K+ annual in-movers chased jobs at Mayo Clinic, Banner, semiconductors.
- Economy: Unemployment below 4%; TSMC’s $65B investment transformed Queen Creek.
- Supply Crunch: Limited land, slow entitlements kept inventory under 4 months most years.
- Lifestyle Lock: Golf, hikes, no state income tax — values rose as desirability did.
Misconception: “It’s all hype.” No — 100%+ appreciation built on fundamentals, not bubbles. Dips like 2023 were healthy corrections.
Implications for Today’s Owners and Buyers
Sellers: Your 2016 purchase likely doubled; now’s equity harvest time with 70-80 DOM. List with desert curb appeal for top dollar.
Buyers: Entry under $400K still exists in Glendale/Mesa; rates at 6% make $450K medians affordable vs. peaks.
Long-term? Experts see 2-4% annual growth through 2026, driven by 200K new jobs.
Your Path Forward
A decade of growth reminds us: Phoenix rewards the patient and prepared. Whether tapping equity or stepping in now, timing aligns with life — schools, relocations, sunsets over South Mountain.
If you’re thinking about making a move in Phoenix, you don’t have to figure it out alone.
I’d love to crunch your numbers or tour comps. Reach out — let’s make sense of it together.
Get the full Phoenix Market Insights → [Market Insights]

-
Cost of Living in Rhode Island: Housing, Taxes, Utilities, and Everyday Expenses
-

What If My Commute Becomes Worse Than Expected?
-
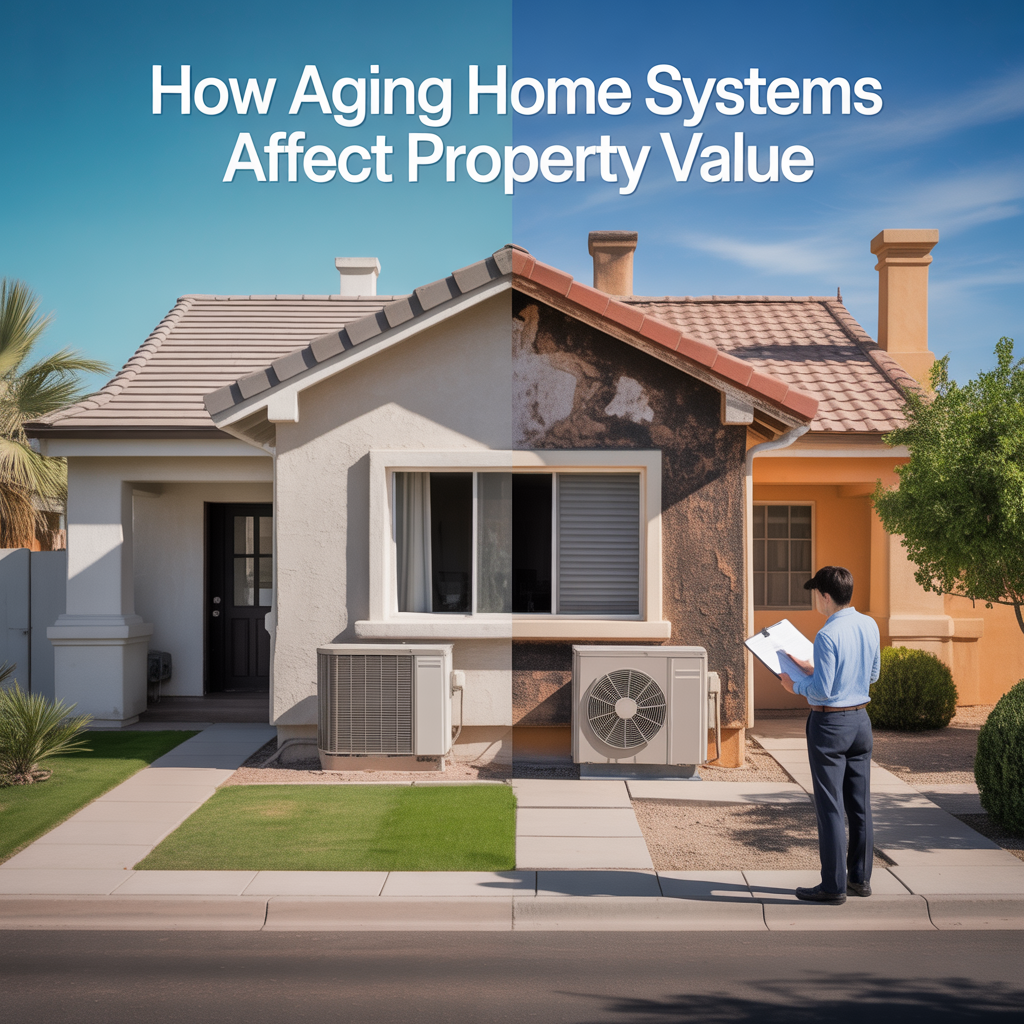
How Aging Home Systems Affect Property Value
-

Energy Efficiency Upgrades for Phoenix Homes
-
How to Plan for Major Home System Replacements
-

When Phoenix Homeowners Should Replace Water Heaters
-

Repair vs Replace Decisions for Phoenix HVAC Systems
-
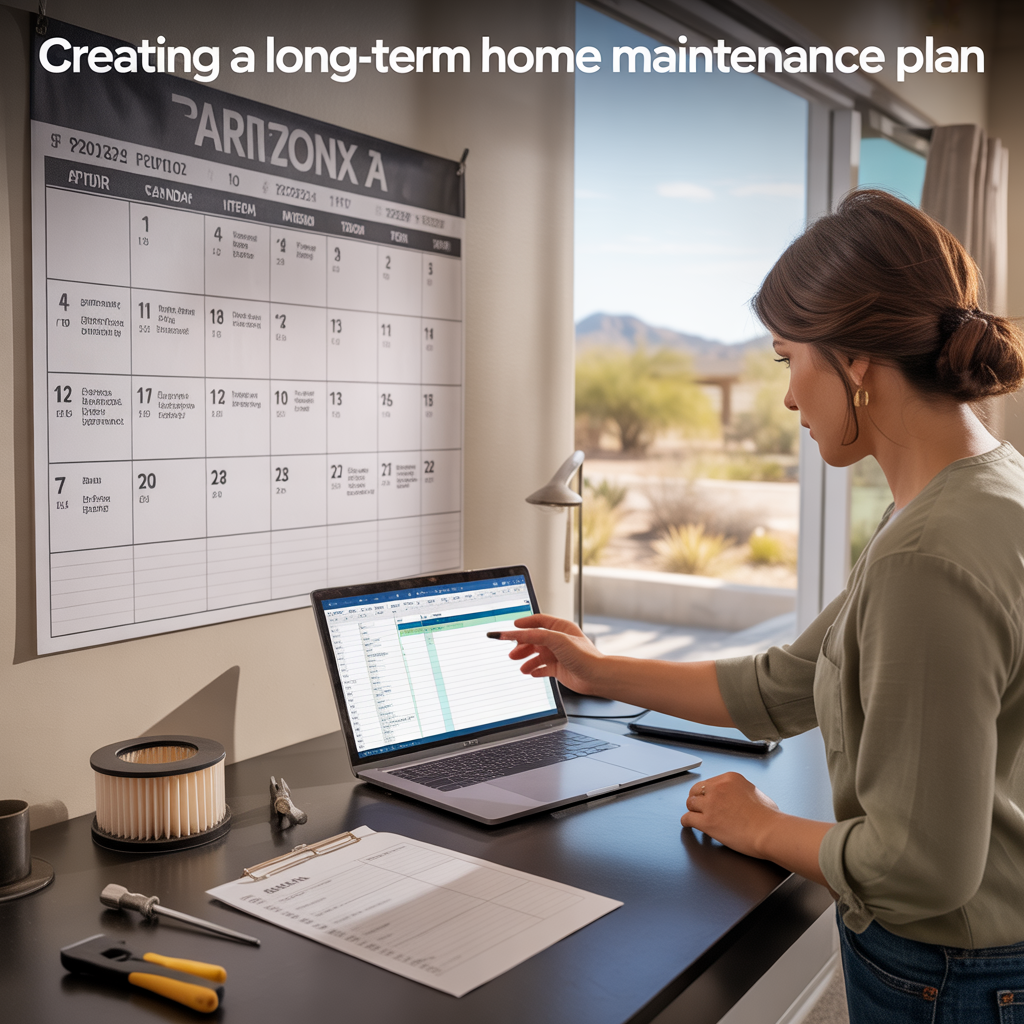
Creating a Long-Term Home Maintenance Plan
-
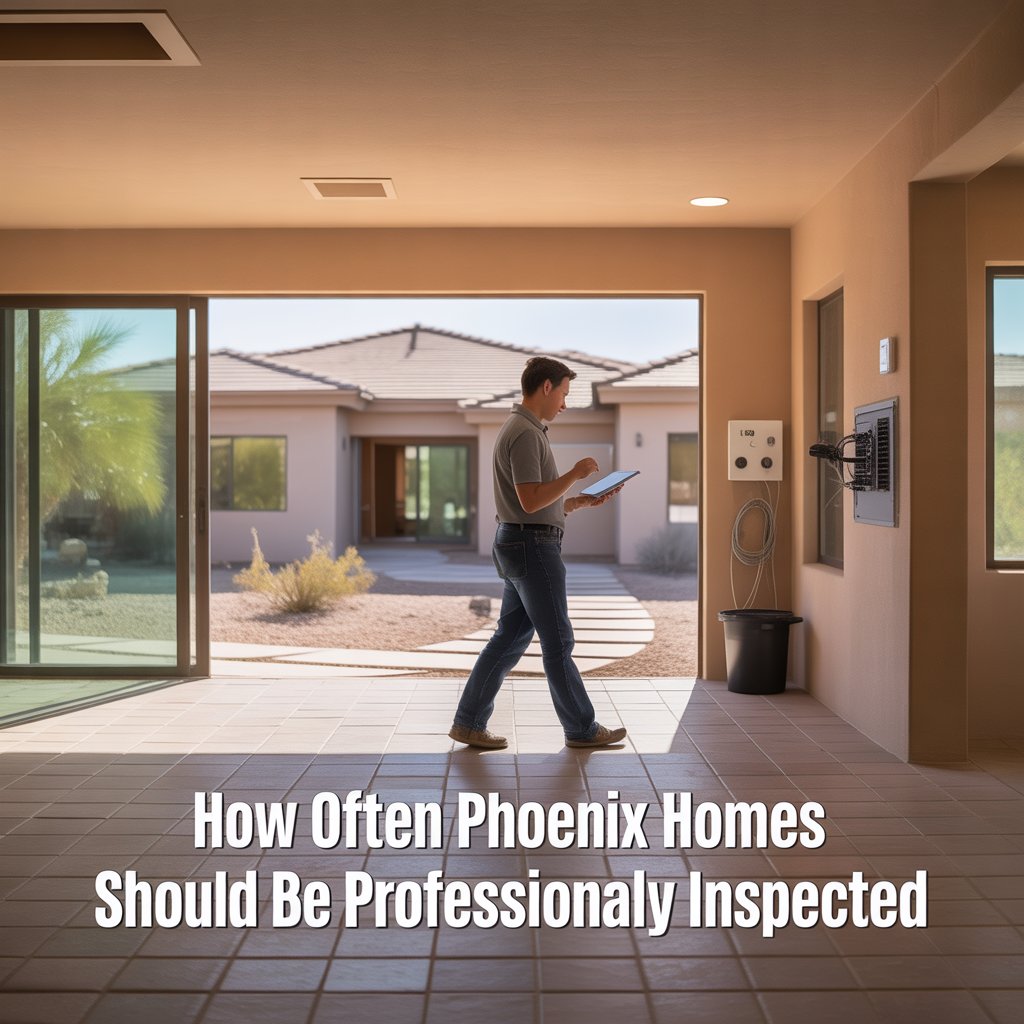
How Often Phoenix Homes Should Be Professionally Inspected
-
Early Warning Signs of Major Home System Failures
-

How Preventative Maintenance Protects Phoenix Property Value
-

The Best Annual Home Maintenance Plan for Phoenix Homes
-

Electrical Safety Inspections for Older Phoenix Homes
-
Why Whole-Home Surge Protection Matters in Arizona
-
Preparing a Phoenix Home for Electric Vehicle Charging
-

Signs Your Home’s Electrical System Is Overloaded
-
When Phoenix Homes Need Electrical Panel Upgrades
-
Water Pressure Problems in Phoenix Homes Explained
-
Preventing Irrigation Leaks That Waste Water in Desert Landscapes
-

Signs of Hidden Plumbing Leaks in Phoenix Houses
-
How Long Water Heaters Last in Arizona Homes
-
How Hard Water Affects Plumbing Systems in Phoenix Homes
-
Preventing Water Damage in Phoenix Homes During Storms
-

Roof Maintenance Tips Before Phoenix Monsoon Season
-
How Arizona Sun Damages Roofing Materials Over Time