


This guide is part of our Phoenix Home Buying Process→ [Phoenix Home Buying Process] & for information on selling visit Phoenix Home Selling Process→ [Phoenix Home Selling Process]
Written by: Renee Burke
If you’re dreaming of settling into a sunlit home in Gilbert or a modern retreat in North Peoria, one of the first questions on your mind is likely this: how much house can I truly afford here in the Phoenix metro? It’s a thoughtful concern, especially with our unique blend of sunny lifestyles and practical costs.
I’ve guided so many families through this exact calculation, helping them balance the excitement of a backyard oasis with the realities of monthly payments. In Arizona, affordability isn’t just about a number—it’s about ensuring your budget supports the life you envision, from weekend hikes in South Mountain to easy commutes along the 202. Let’s walk through it together, step by step.
Key Factors That Shape Your Phoenix Budget
Lenders here use a few core metrics to determine your buying power, tailored to our local market where median home prices sit around $525,000 in early 2026. Your debt-to-income (DTI) ratio is king—aim for no more than 36-43% of your gross monthly income on housing, though up to 48-50% is possible with strong credit.
Down payment, interest rates (hovering at 6.5-7%), property taxes (about 0.62% annually), and HOA fees also play in. Add homeowners insurance ($1,500-2,500/year) and summer utilities, and the picture sharpens.
Here’s a snapshot of affordability based on income, using conservative 36% DTI, 3-5% down, and Phoenix-specific costs:
These are starting points—plug your details into a local calculator for precision.
Phoenix-Specific Costs You Can’t Ignore
Our Valley life adds layers. Property taxes vary: lower in Maricopa County suburbs like Queen Creek (0.55%), higher near Scottsdale (0.7%). HOAs in master-planned communities like Eastmark run $150-350/month for pools and trails.
Don’t forget closing costs (2-5% of price, or $10K-$25K on a $500K home) and escrows for taxes/insurance. In hot spots like Desert Ridge, factor in potential Mello-Roos fees for newer developments. A $500K home might mean $3,200/month total with 20% down—leaving room for Papago Golf fees or family outings to the Musical Instrument Museum.
DTI Scenarios: Conservative vs. Aggressive
I always encourage a conservative approach for long-term peace. Here’s how DTI plays out for a $120K household income at 6.75% rate:
Lower DTI means breathing room for our unpredictable monsoons or rising energy bills.
Lifestyle Alignment: Beyond the Numbers
Affordability is personal. A $450K budget in Goodyear gets you a 4-bed with pool and mountain views—perfect for trail runs at Estrella. Same budget in Arcadia? A cozy fixer with historic charm, steps from AJ’s Fine Foods.
Consider your commute: closer to the 101 saves time (and gas) for evenings at Diablo Stadium. Families prioritize Chandler Unified schools; remote workers eye North Gateway. Pre-approval reveals your true range, so you’re not heartbroken by a listing just out of reach.
Addressing Common Worries
Many fear they’ll overextend. Truth: Lenders stress-test for rate hikes, and Arizona’s no-tax-on-food helps. Self-employed buyers (common in our tech/retail boom) shine with two years’ returns. Recent changes favor thinner credit files via new FICO models.
Another: “Rates are high.” Yes, but inventory up 15% eases pressure—focus on total cost, not just payment.
Practical Steps to Calculate Yours
- Gather income (gross), debts (car, student loans), savings for down (3-20%).
- Use a Phoenix-tuned tool—input local taxes/HOA.
- Get pre-approved: reveals lender-specific limits.
- Stress-test: Add 1-2% to rates, see if it fits.
- Budget buffer: Keep housing under 30% for Valley spontaneity.
Clients who do this land confidently, like the duo who afforded a South Tempe townhome with space for their food truck passion.
The Heart of Homeownership Here
It’s about roots: grilling in your Queen Creek backyard, biking Gilbert trails, symphony nights in Downtown. True affordability lets those joys thrive without worry.
If you’re thinking about making a move in Phoenix, you don’t have to figure it out alone. Reach out anytime—I’m here to crunch your numbers, tour fitting neighborhoods, and guide you home with calm expertise.
Get the full Phoenix Market Insights → [Market Insights]

-

How the Phoenix Desert Climate Shapes Everyday Life Inside the Home
-

How Phoenix Weather Patterns Shape Everyday Home Routines
-
Why Homes Often Feel More Comfortable After the First Year of Ownership
-
How Living in Phoenix Changes the Way Homeowners Use Their Homes
-
What New Phoenix Homeowners Learn During Their First Year of Ownership
-

How Daily Life Changes After the First Year of Living in a Phoenix Home
-
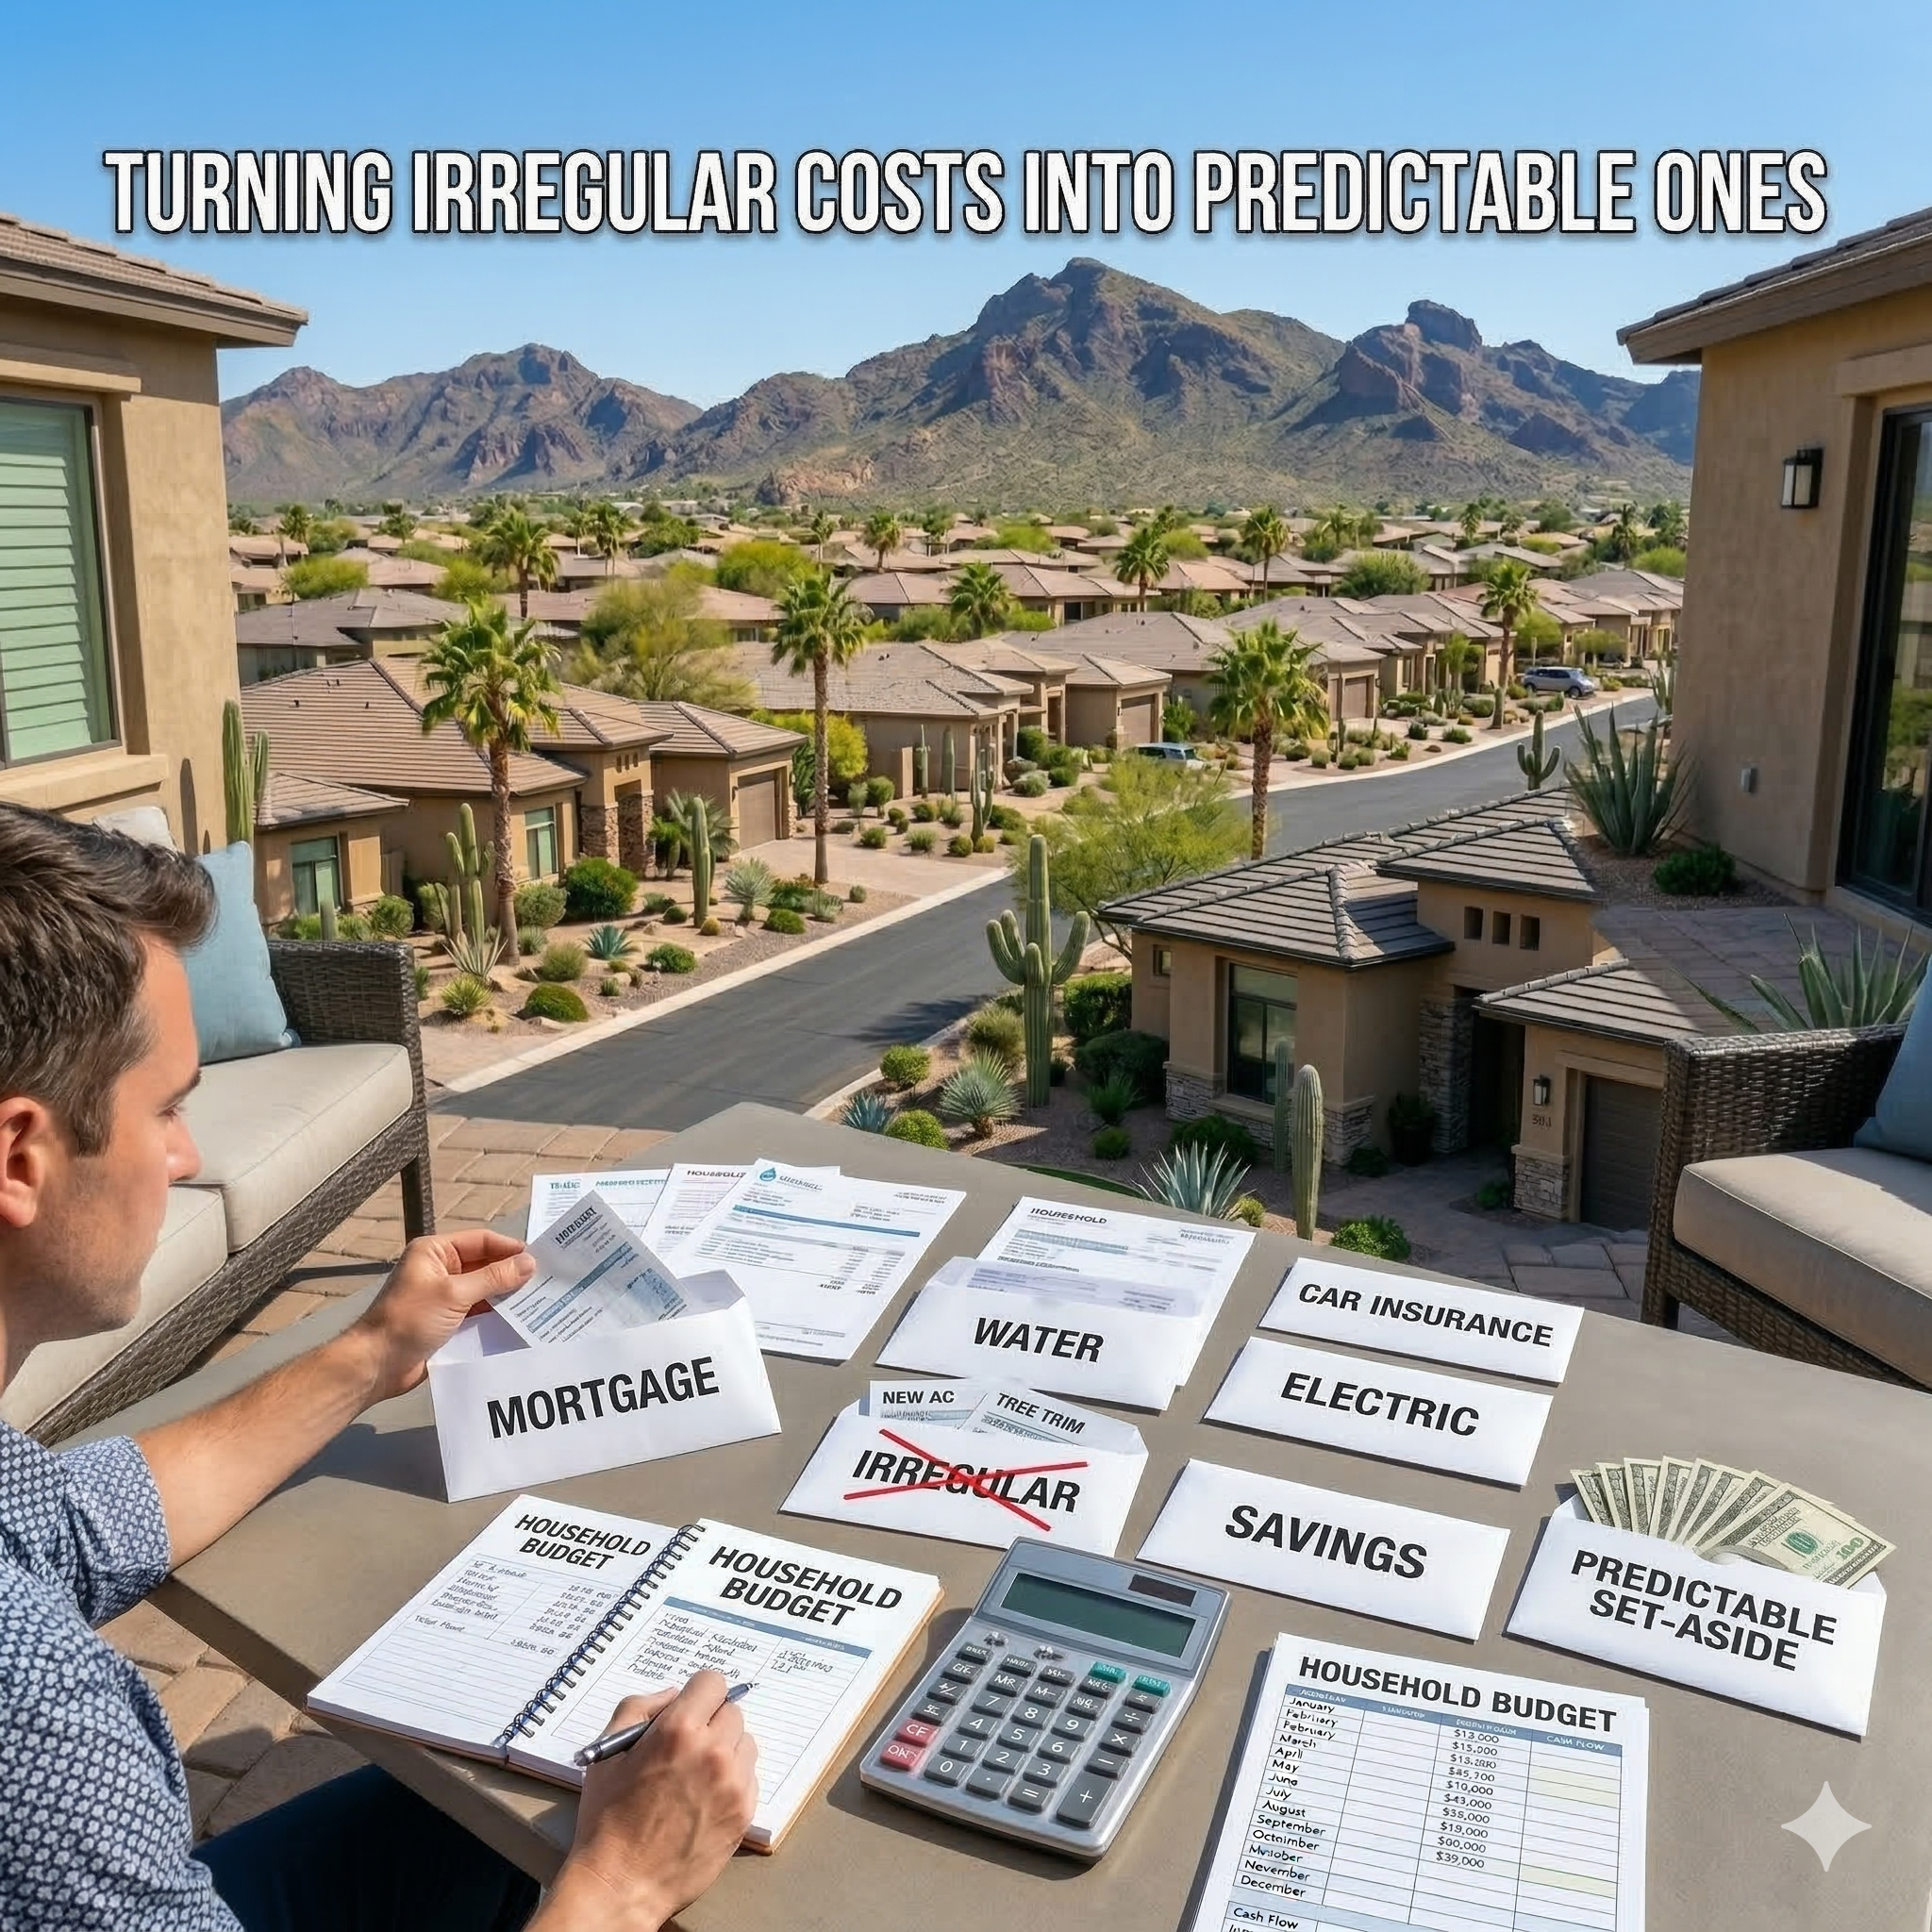
Turning Irregular Costs Into Predictable Ones
-

Budgeting for Ongoing Ownership
-
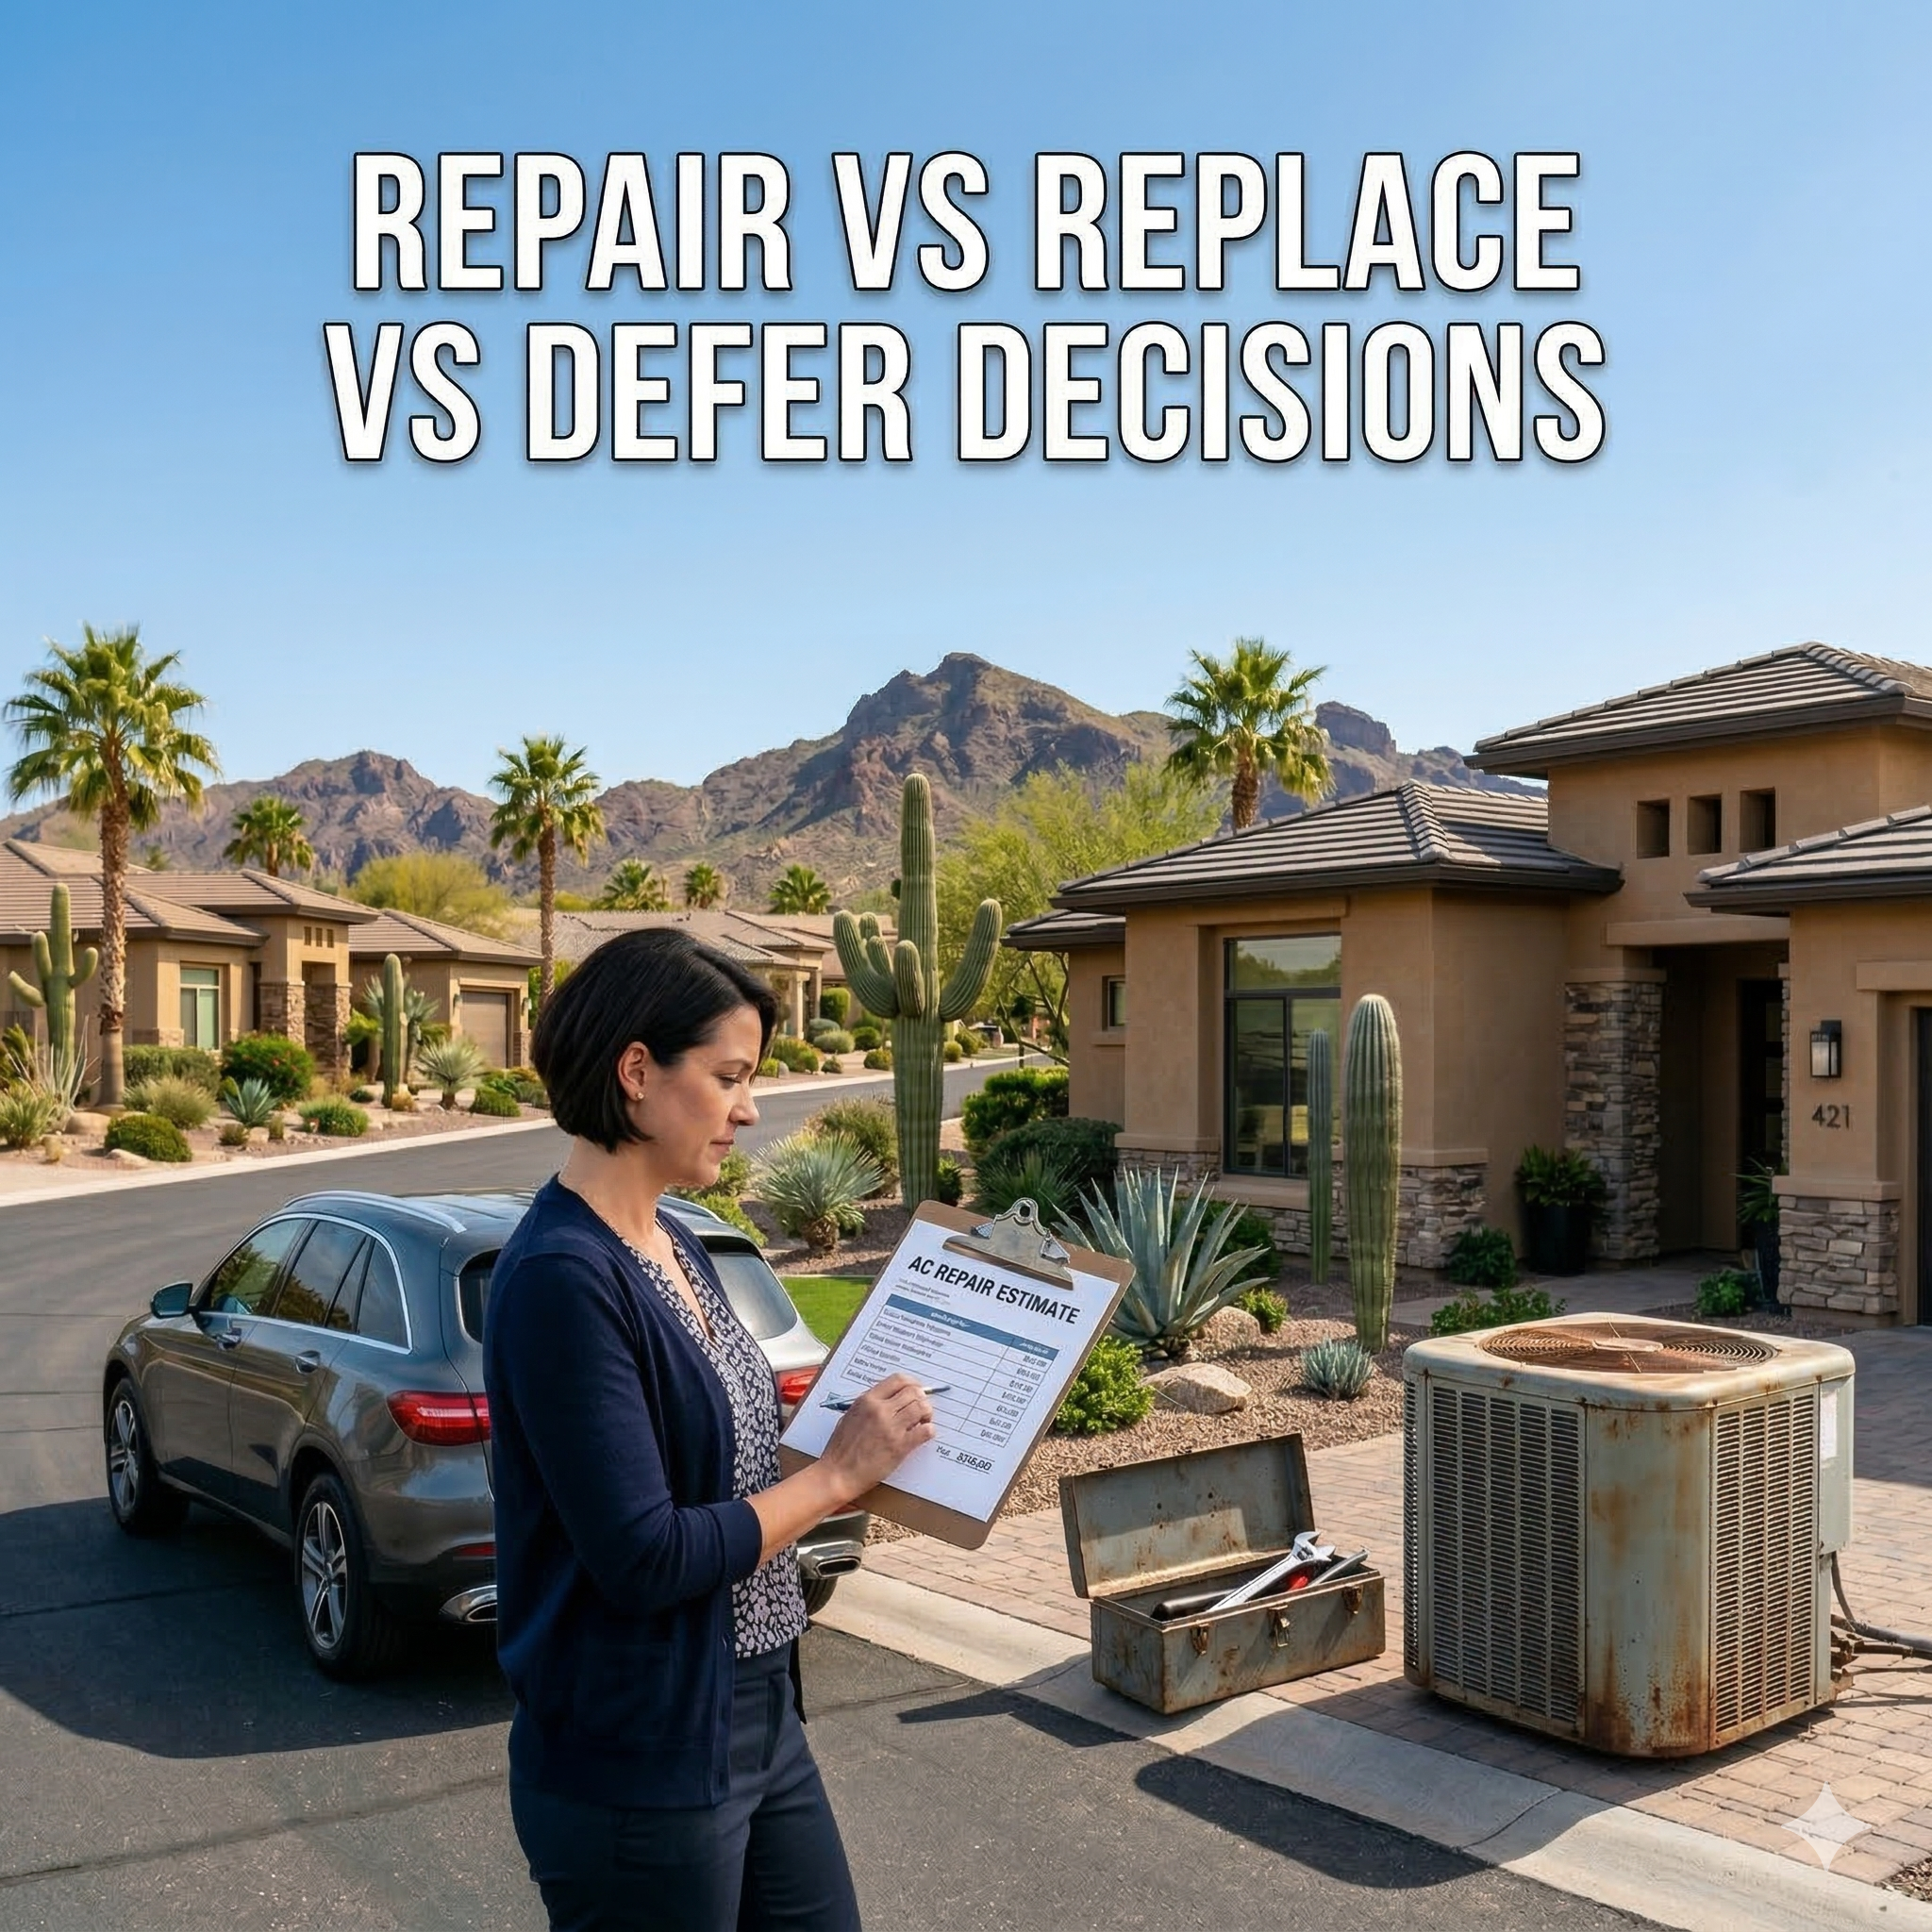
Repair vs Replace vs Defer Decisions
-

Planning Homeownership Like a Long-Term Asset
-
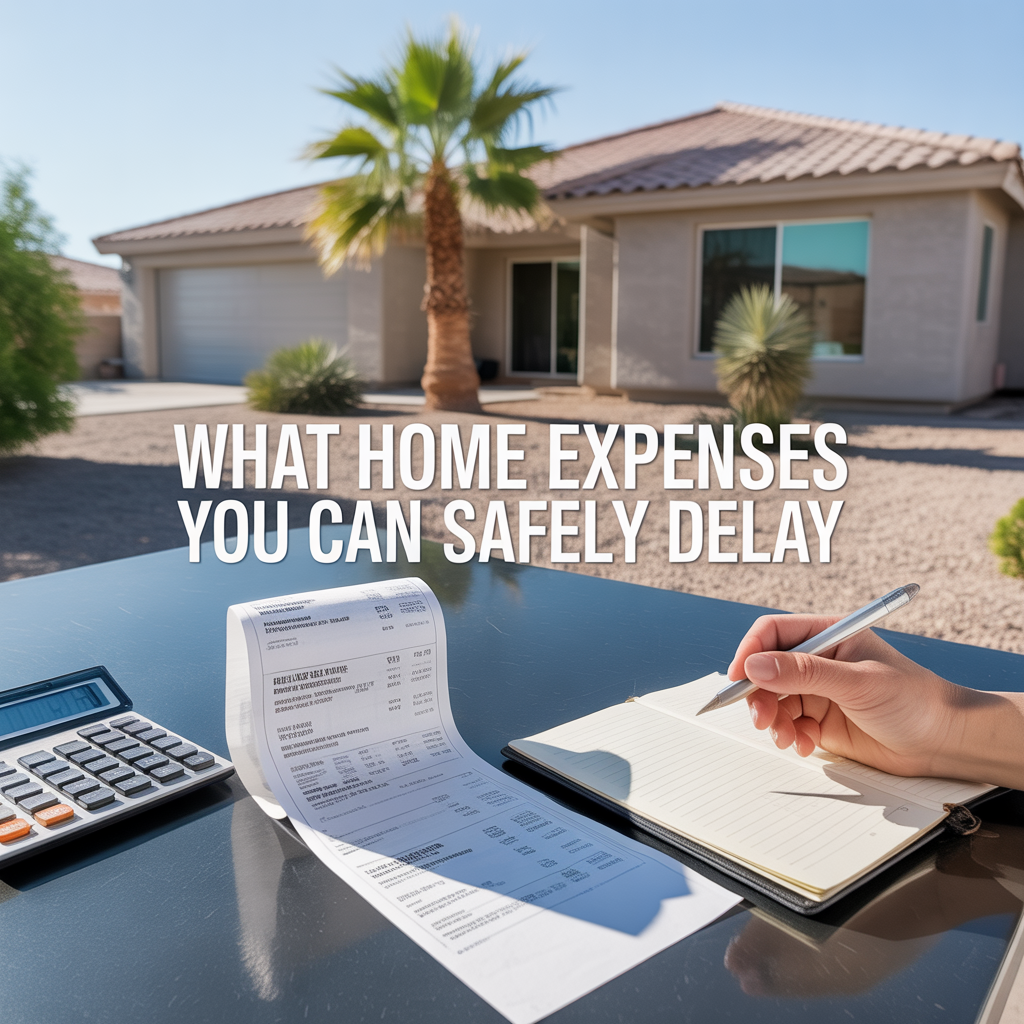
What Home Expenses You Can Safely Delay
-
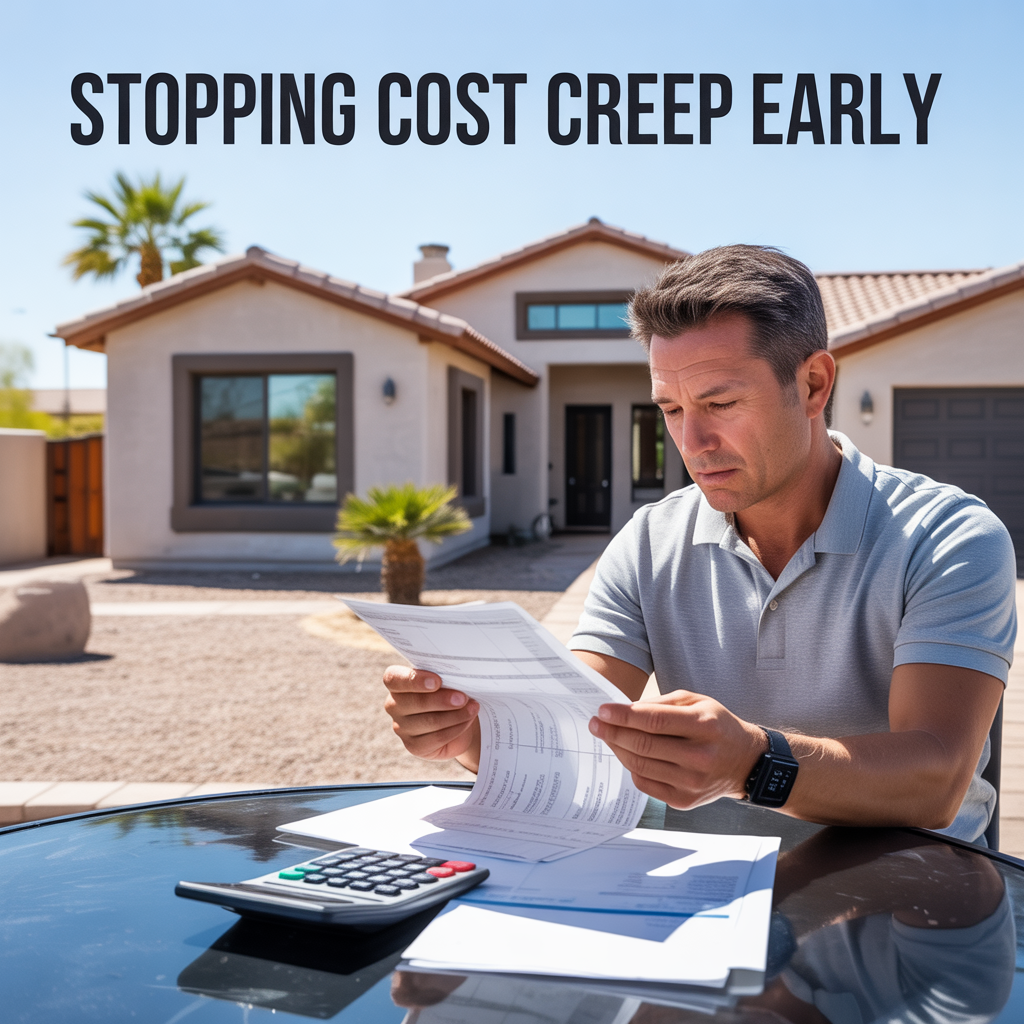
Stopping Cost Creep Early
-

Cash Flow vs Net Worth Stress
-
Why “It’s Not That Much” Adds Up
-
Warning Signs Your Ownership Budget Is Tightening
-
The Cumulative Cost of Small Home Repairs
-
Designing Budgets Around Local Conditions
-
Utility Costs Over Time in Desert Climates
-

Insurance Increases Explained for Arizona Homeowners
-
How Inflation Impacts Phoenix Homeownership Costs
-
Avoiding Debt-Driven Homeownership Decisions
-

Replacing Systems on Your Timeline
-

Why Emergency Repairs Cost More
-

Timing Major Expenses Without Financial Shock
-
How Much to Keep in a Phoenix Home Reserve Fund