


This guide is part of our Phoenix Investors Guide → [Phoenix Investors Guide]
Written by: Renee Burke
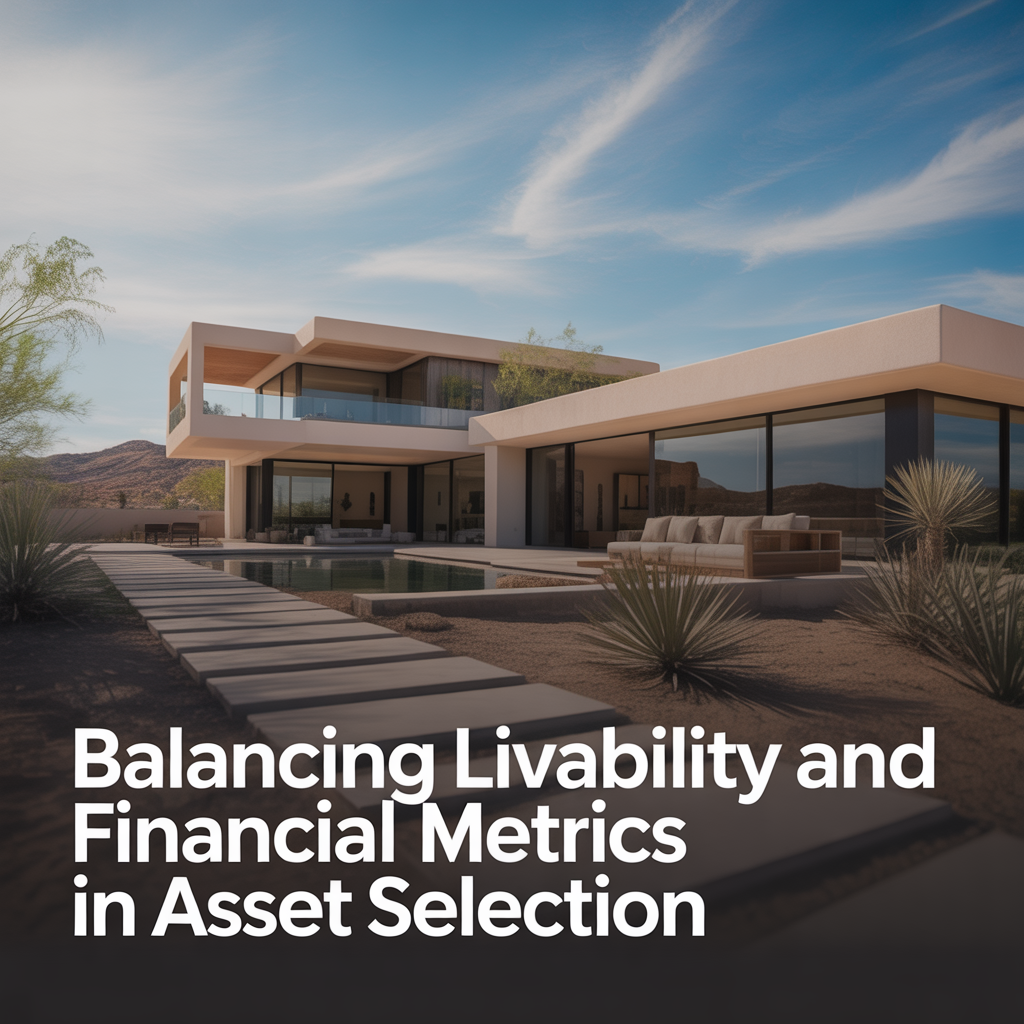
Choosing the right investment property in Phoenix starts with a delicate balance — one that weighs crisp financial returns against the everyday realities of how people actually live here in the Valley. It’s tempting to chase the highest cap rate or cash-on-cash return, but without considering livability, even the best numbers can lead to headaches down the road.
I’ve guided so many investors through this process right here in our Phoenix metro, from the bustling streets of Downtown to the quiet foothills of North Scottsdale. What I’ve seen time and again is that properties blending strong financials with genuine appeal to tenants or future buyers hold their value longest and perform most reliably.
Why Livability Matters as Much as the Numbers
Phoenix isn’t just a spreadsheet of rental yields and appreciation forecasts — it’s a place where summer heat shapes daily routines, where mountain views lift spirits, and where proximity to a neighborhood pool can make or break tenant retention. Livability ensures your asset doesn’t just generate income today, but remains desirable tomorrow, whether you’re holding for cash flow or positioning for resale.
Overlooking this balance often stems from a common fear: prioritizing “feel” over facts feels risky in a market as competitive as ours. But here’s the gentle truth — the most profitable Phoenix investments marry both. A high-yield property in a low-walkability zone might cash flow initially, but higher turnover, maintenance calls, and vacancy risks erode those gains over time.
Key Financial Metrics to Anchor Your Decision
Start with the fundamentals that keep your investment grounded. In Phoenix, these numbers tell a story unique to our growth patterns and desert economy.
Cap rate gives a snapshot of potential return based on net operating income divided by purchase price — aim for 6-9% in stable areas like Gilbert or Chandler, where long-term holds shine. Cash-on-cash return factors in your actual down payment and financing, often hitting 8-12% for well-selected single-family rentals near job centers like the Intel campus in Chandler.
Don’t forget the all-in picture: vacancy rates hover around 5-6% Valley-wide, but dip lower in family-friendly spots like Ahwatukee. Factor in our property taxes (around 0.7% of assessed value) and HOA fees, which can add 10-15% to monthly costs in master-planned communities like Verrado.
Livability Factors That Drive Real Returns
Livability isn’t fluff — it directly boosts occupancy, reduces capex, and supports rent growth. In Phoenix, it boils down to features that align with how we live under our relentless sun.
Outdoor living spaces top the list: shaded patios with misters, private pools, or built-in BBQs command 10-20% rent premiums in neighborhoods like Arcadia or Desert Ridge. Energy-efficient upgrades — think spray-foam insulation, high-SEER AC units, and low-E windows — slash utility bills by 20-30%, making properties more tenant-friendly and lowering your turnover costs.
Location layers in lifestyle appeal. Proximity to trails in South Mountain or the light rail in Downtown Tempe draws active renters willing to pay more. Schools matter deeply too — zones like Basis schools in North Phoenix support family stability and faster appreciation.
Neighborhood Case Studies: Where Balance Wins
Phoenix’s micro-markets highlight this interplay beautifully. Let’s walk through a few.
Tempe stands out for balanced performers: university demand and Town Lake access yield 84% occupancy and 9%+ cash-on-cash returns, paired with low seasonality. Properties here thrive with workspaces and soundproofing, blending student energy with professional livability.
Downtown Phoenix offers urban vibrancy — 82% occupancy at $225 average daily rates for short-term rentals, but success hinges on security and balconies with views. It’s financial upside with city pulse, ideal if your tenants crave walkability to Roosevelt Row.
Scottsdale’s Kierland area marries luxury livability (resort pools, golf proximity) with solid 7-8% returns. Mountain views and shopping access justify higher acquisition costs, but only if maintenance keeps pace with guest expectations.
In contrast, Paradise Valley tempts with ultra-high ADRs near $900, yet 62% occupancy and steep operating costs demand flawless execution. It’s a reminder: luxury livability amplifies financials, but mismatches lead to summer slumps.
| Neighborhood | Avg Cap Rate | Occupancy | Key Livability Driver | Rent Premium |
|---|---|---|---|---|
| Tempe | 9.2% | 84% | Walkability to ASU/Lake | 20-25% for views |
| Downtown | 8.5% | 82% | Urban amenities/security | 15% for balconies |
| Scottsdale | 7.8% | 74% | Golf/resort pools | 25% for pools |
| Paradise Valley | 6.5% | 62% | Mountain privacy | 15-20% for luxury kitchens |
Common Pitfalls and How to Avoid Them
I hear the worries often: “What if I overpay for ‘lifestyle’ features?” or “Will high livability mean lower yields?” The key is vetting rigorously.
One misconception is ignoring seasonality — Paradise Valley shines in winter but challenges in summer without shaded outdoor spaces. Another: assuming all growth areas are equal. East Valley tech hubs like Mesa offer steady cash flow with family livability, outperforming speculative West Valley edges prone to over-supply.
Test your balance with pro formas that stress-test vacancy at 10%, capex at 1% of value annually, and rent growth at 3%. Layer in livability by scoring properties: deduct for no pool in pool country, add for trail access in active zones.
Blending the Two for Long-Term Success
The sweet spot emerges when financial metrics support livable design. A Chandler single-family with a misted backyard and solar panels might yield 8% cash-on-cash while commanding $2,500 rents from traveling nurses near Banner Gateway. It’s cash flow today, plus 5-7% annual appreciation from neighborhood maturation.
Phoenix’s trajectory — tech influx, snowbird cycles, young professional migration — favors this approach. Properties near Mayo Clinic or TSMC plants in North Phoenix blend medical/corporate demand with wellness features like home gyms, ensuring resilience.
Making the Decision Feel Right
Balancing these elements takes patience, but it’s where confidence blooms. You’re not just buying an asset; you’re curating a piece of Valley life that pays dividends — financially and otherwise. I’ve seen investors sleep better knowing their property isn’t just a number, but a smart fit for real people.
If you’re sizing up Phoenix opportunities, let’s map this balance together — your goals, the metrics, the lifestyle fit.
If you’re thinking about making a move in Phoenix, you don’t have to figure it out alone. Reach out anytime; I’m here to guide you with the steady hand of someone who knows this market inside out.
Get the full Phoenix Market Insights → [Market Insights]


-
Cost of Living in Rhode Island: Housing, Taxes, Utilities, and Everyday Expenses
-

What If My Commute Becomes Worse Than Expected?
-
How Aging Home Systems Affect Property Value