



Market and Timing Fears→ [Market and Timing Fears] & For more info on other fears Phoenix Real Estate → [Phoenix Real Estate Fears Guide]
Written by: Renee Burke
Absorption rates can feel like a mysterious number at first glance, especially when headlines scream “market shift” or “buyer’s paradise.” But here in Phoenix, they’re simply a snapshot of how quickly homes sell in specific areas—nothing more dramatic than that. As someone who’s tracked these metrics across our Valley neighborhoods for years, I’ll walk you through what they really mean, so you can use them confidently without the worry.
Let’s break it down gently, focusing on how Phoenix’s unique rhythms make these numbers work for you rather than against you.
What Absorption Rates Actually Measure
Absorption rate shows the percentage of active listings sold in a given period, usually a month. Calculate it as homes sold divided by total active listings, then multiplied by 100. A 20%+ rate signals a seller’s market—homes vanish fast. Below 15% leans buyer-friendly, with more breathing room. Between 15–20%? Balanced, like much of our metro right now.
In Phoenix, we often hear about months of inventory instead—the flip side, showing how long current supply would last at today’s sales pace. Under 5 months favors sellers; over 6 months tilts to buyers. Our Valley hovers in that 4–6 month sweet spot lately, steady but not stagnant.
Don’t panic at raw numbers. Context matters: a 3-month rate in Gilbert’s family lakes isn’t the same as outer Buckeye’s growth phase.
Phoenix-Specific Patterns
Our desert market absorbs differently than national averages. Winter snowbirds boost central and Scottsdale rates to 25%+, as they snap up patios and pools. Summer dips to 10–12% Valley-wide—heat pauses showings, but serious locals keep pendings alive.
Micro markets vary wildly:
- Hot pockets like Arcadia or North Central rarely dip below 18%, thanks to lifestyle pull.
- Growth edges (Surprise, Queen Creek) absorb slower at 12–15%, as infrastructure catches demand.
- Luxury ($1M+) stays tight year-round; entry-level fluctuates more with family moves.
Recent data shows resale absorption strengthening over new builds, as buyers favor proven neighborhoods amid builder delays.
Common Fears and Misconceptions
I hear the worry often: “Rising absorption time means crash!” Not here. Longer days on market (our current 40–60) reflect selective buyers, not panic selling. Strong jobs—TSMC, healthcare—sustain demand, preventing 2008-style floods.
Another trap: “Low absorption everywhere equals doom.” False—our 4–5 month inventory balances nicely, with concessions (credits, buydowns) rising instead of price slashes. Snowbird cycles and migration keep us resilient.
Buyers fear missing bottoms; sellers dread stagnation. Truth: Phoenix absorbs steadily, rewarding strategy over speed.
How Buyers Can Use Absorption Wisely
- High rate (20%+): Move fast in peak pockets—pre-approve for Gilbert springs or Scottsdale winters.
- Low rate (<15%): Negotiate summer lulls; target motivated resales with outdoor appeal.
- Balanced (15–20%): Shop confidently now—leverage without frenzy.
Watch zip-specific rates on ARMLS. Pair with pendings: rising closings signal true momentum.
How Sellers Can Respond Calmly
Price to current absorption—overpriced homes skew stats. In slow segments, enhance desert curb appeal: lush xeriscaping, misters for patios. Time listings post-monsoon for fall energy.
Even at 5 months inventory, staged homes in lifestyle havens absorb 20–30% faster. Patience pays; panic pricing doesn’t.
Absorption in Lifestyle Context
Numbers gain meaning through how we live—trail access in Ahwatukee absorbs quicker than distant spec homes. Wellness features (pools, shaded ramadas) speed sales when heat tests patios. Job corridors lift West Valley rates steadily.
Phoenix’s absorption reflects sun, jobs, and migration—not Wall Street swings.
Spotting Opportunities Amid the Data
Track trends, not snapshots:
- Resales outperform new builds now.
- Family segments balance; luxury stays tight.
- Seasonal dips create entry points.
Breathe easy—our market absorbs thoughtfully, favoring informed steps.
If you’re thinking about making a move in Phoenix, you don’t have to figure it out alone. I’m always glad to share what I see happening on the ground and help you read these patterns in a way that fits your goals, your lifestyle, and your peace of mind.
Get the full Phoenix Market Insights → [Market Insights]


-
Cost of Living in Rhode Island: Housing, Taxes, Utilities, and Everyday Expenses
-

What If My Commute Becomes Worse Than Expected?
-
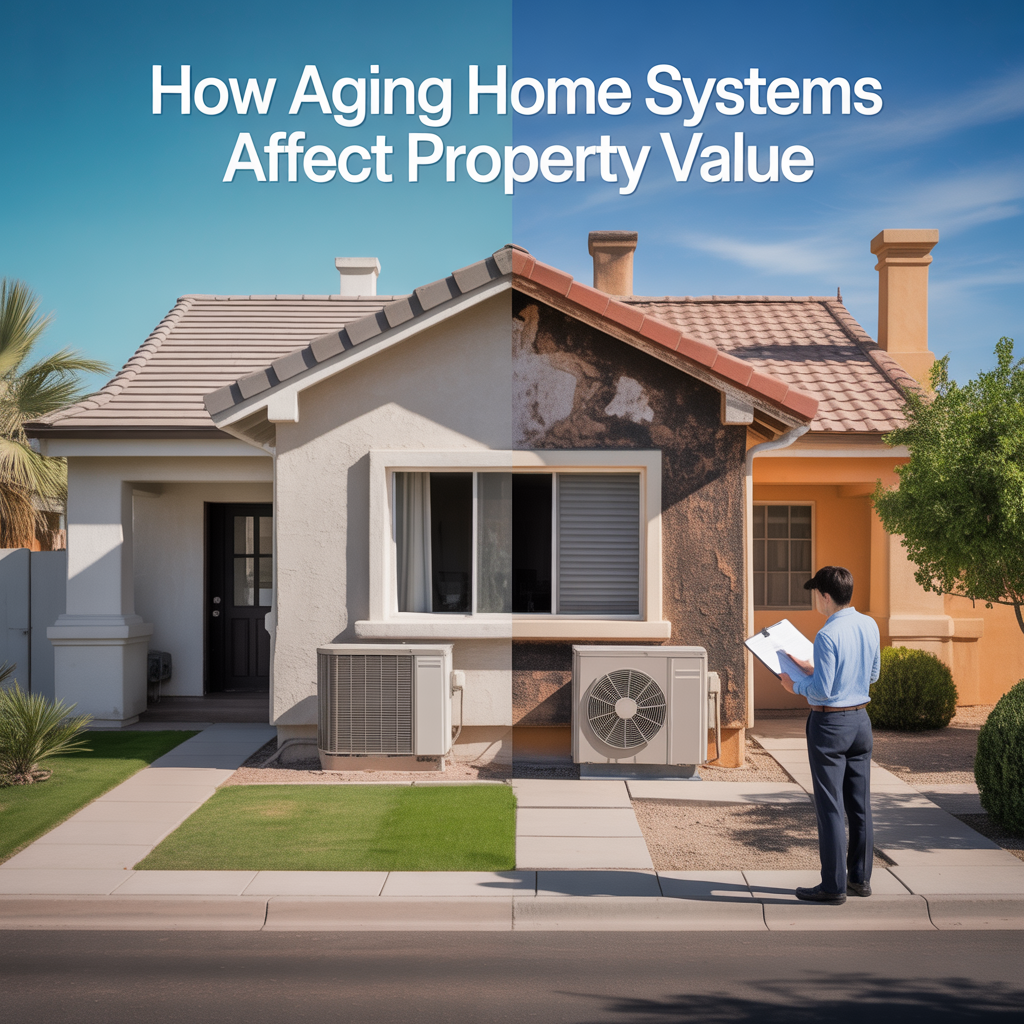
How Aging Home Systems Affect Property Value