


National Politics and Housing → [National Politics and Housing] & For more info on Local Politics and Housing→ [Local Politics and Housing]
Written by: Renee Burke
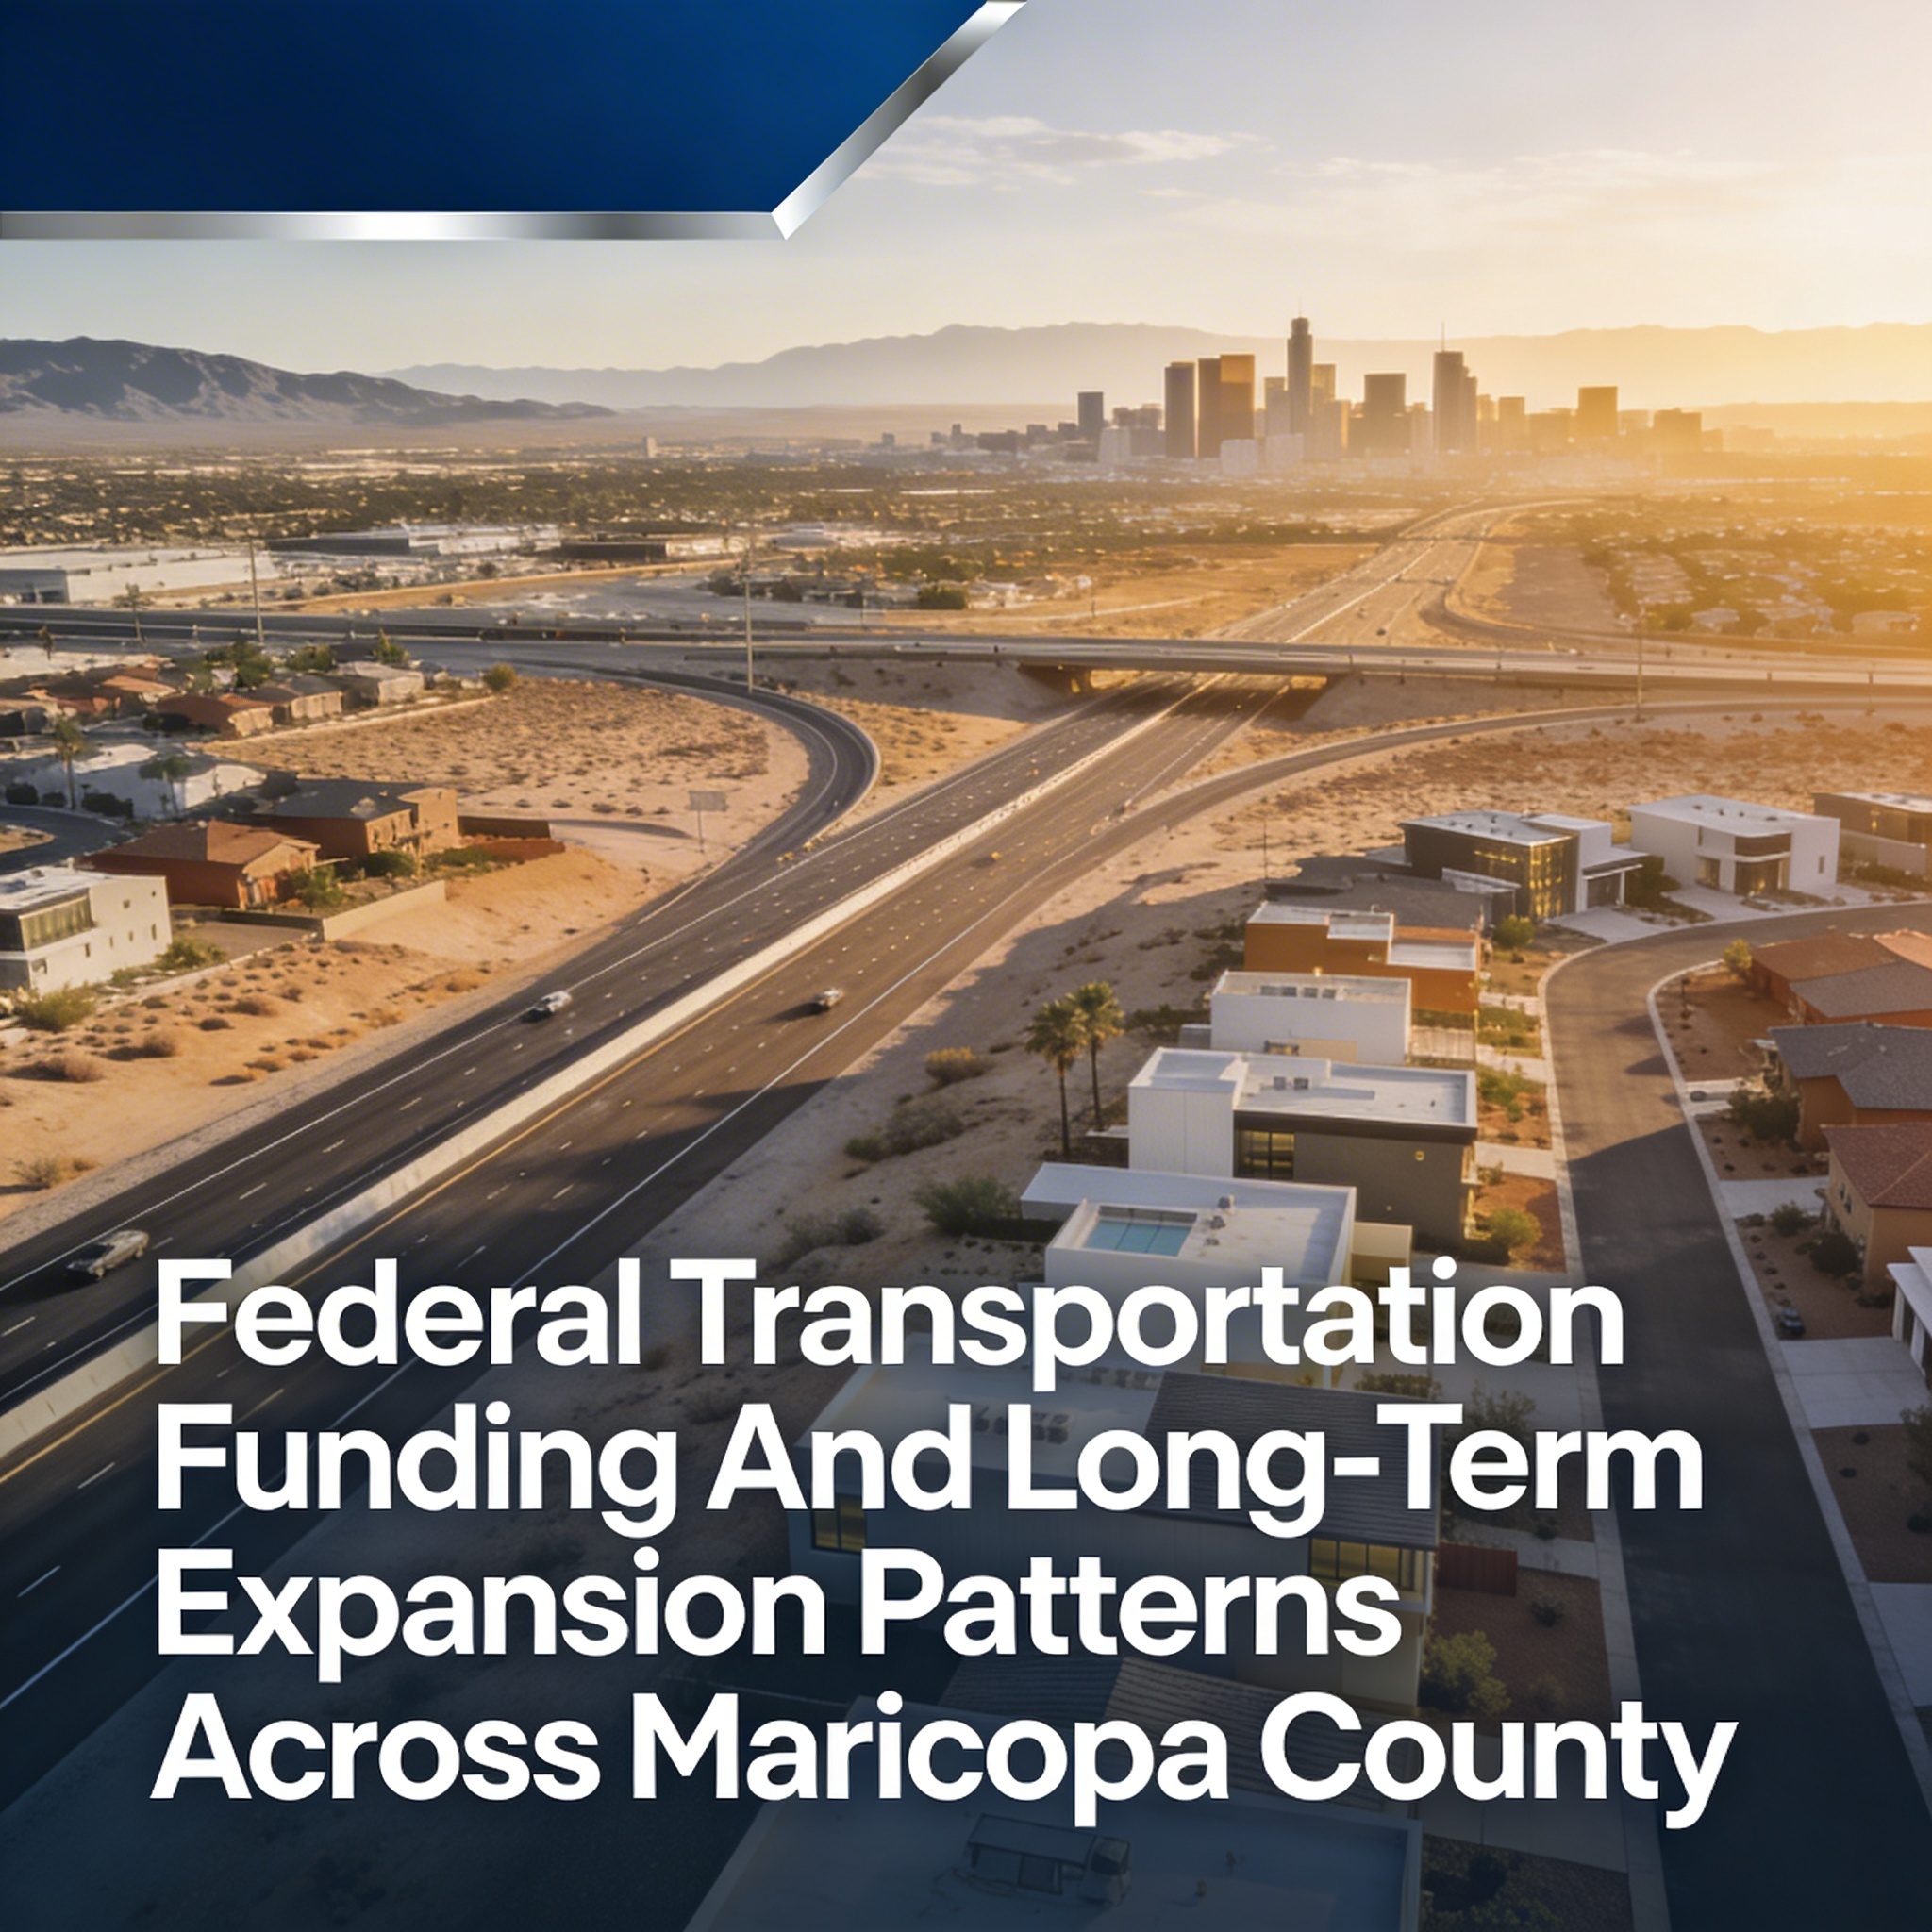
Maricopa County’s growth has always hinged on getting around—whether it’s the daily commute to TSMC or weekend escapes to the White Tanks. Federal transportation funding, flowing through massive programs like the Bipartisan Infrastructure Law, is steering long-term expansion patterns that will redefine our roads, rails, and neighborhoods for decades.
I’ve helped families plan moves around these very arteries, knowing where pavement meets possibility. Let’s map how these dollars shape Maricopa’s future, blending policy with the Valley lifestyle we cherish.
Federal Dollars Fuel the Five-Year Blueprint
Arizona’s $12.7 billion 2026-2030 transportation plan leans heavily on federal grants—$2.38 billion programmed for Maricopa alone via MAG collaboration. Proposition 479’s half-cent sales tax extension adds landscape maintenance and litter control, but federal streams drive expansion: I-10 widenings, Loop 303 extensions, SR 74 improvements.
These funds prioritize preservation (50%+ of budgets) alongside bold growth—$137 million for I-10 south of Phoenix to Gas Line Road alone unlocks West Valley trajectories. EV charging gets $15 million via FHWA’s CFI, dotting corridors with future-proof infrastructure.
West Valley: The Primary Expansion Frontier
I-10 and Loop 303 form the backbone, with federal matches accelerating Buckeye to Avondale stretches. Long-term: continuous freeway loops supporting 100,000+ new residents, new interchanges at Dysart and Cotton Lane feeding master-plans like Teravalis.
Growth radiates to Goodyear’s warehouses and Litchfield Park estates—commutes drop 20-30%, drawing families who want space without isolation. Subdivisions bloom here first, as funding precedes homes.
North Valley Tech and Gateway Push
SR 303L and 303R expansions—$175M+ in District 1—link North Gateway to Phoenix Sky Harbor, vital for Intel and data center workers. Federal grants modernize bridges, add HOV lanes, positioning Norterra and Happy Valley as hybrid live-work hubs.
Long-term pattern: denser townhomes near employment, buffered suburbs beyond. This corridor cements Maricopa’s role as semiconductor capital.
East and South Corridors: Connectivity Hubs
US 60 realignments and SR 347 upgrades (with Prop 479 bolstering) ease Queen Creek to Chandler flows. South Mountain gains light rail extensions eyed for federal Capital Investment Grants, knitting Downtown to Laveen revitalization.
Pattern: infill transit nodes spur urban-style multifamily; outer edges fill with single-family as South Valley absorbs migration.
Addressing Growth Growing Pains
Families often share: “Renee, will traffic worsen before it improves?” Or “Does expansion mean my quiet neighborhood changes?” Construction disrupts—yes—but phases minimize pain, with signals and ramps opening sequentially.
Misconception: funding skips maintenance. Reality: preservation dominates budgets, ensuring I-17 reliability amid booms.
Lifestyle Enhanced by Better Mobility
These patterns elevate Valley days: West Valley families golf in Verrado post-commute; North pros hike Sonoran Preserve after shift. EV-ready freeways suit our endless drives to Sedona; HOV lanes tame rush hour for soccer carpools.
Long-term: Maricopa evolves balanced—jobs accessible, escapes preserved—keeping our sun-drenched freedom intact.
Projected Patterns Through 2040
By decade’s end, loops close: full 303 ring, I-10 to I-17 seamless. Inventory follows—West/North lead single-family waves, Central/East mix multifamily with townhomes. Population hits 6M+, but funding scales infrastructure proportionally.
Phoenix stays livable: sprawl checked by transit, suburbs thriving where roads reach.
Let’s Align Your Move with the Map
Federal funding redraws Maricopa thoughtfully, creating value where vision meets asphalt. If these patterns influence your plans—from West Valley upsizing to North tech buys—I’m your grounded guide.
If you’re thinking about making a move in Phoenix, you don’t have to figure it out alone. Reach out—we’ll trace the expansions to your perfect spot and move forward with steady confidence.
Get the full Phoenix Market Insights → [Market Insights]


-
Cost of Living in Rhode Island: Housing, Taxes, Utilities, and Everyday Expenses
-

What If My Commute Becomes Worse Than Expected?
-

How Aging Home Systems Affect Property Value