


Chandler Lifestyle Guide → [Chandler Lifestyle Guide] & For more info on Chandler Real Estate → [Chandler Real Estate Guide]
Written by: Renee Burke
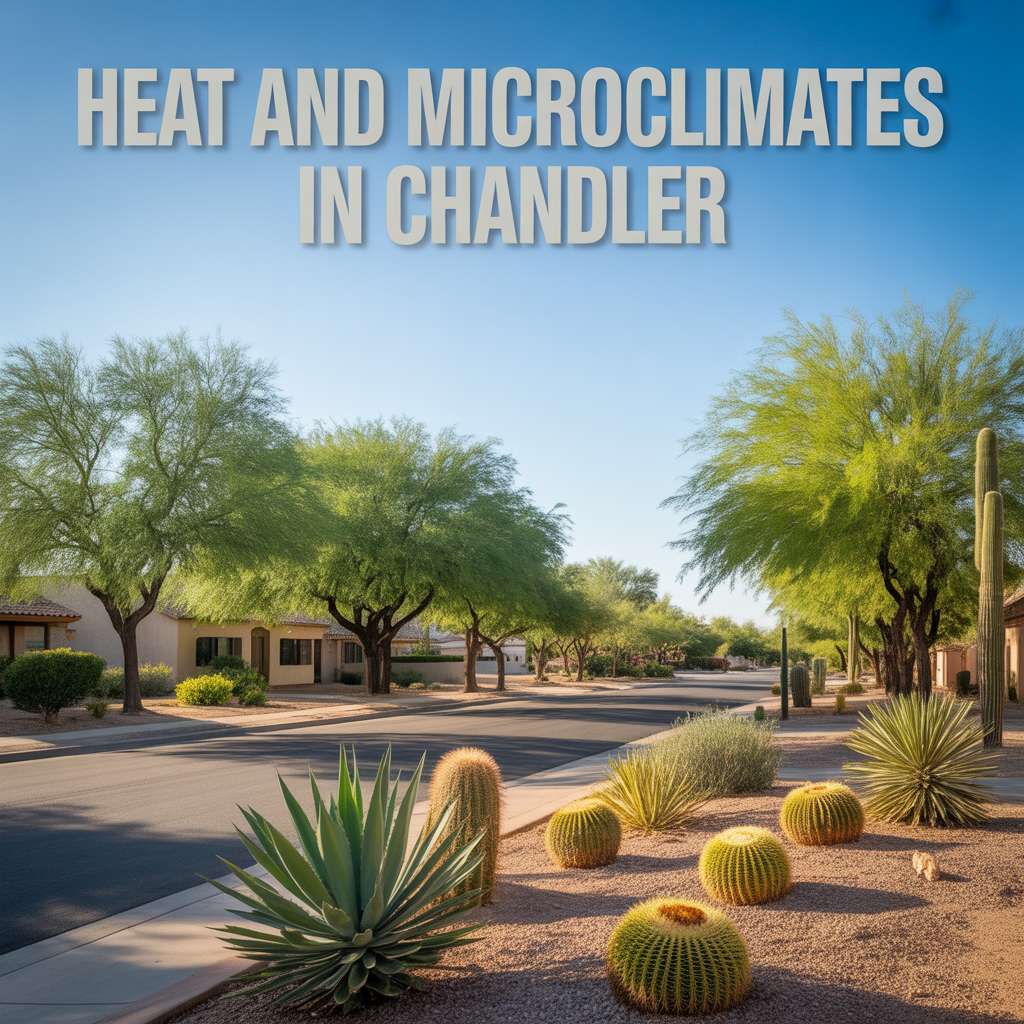
Heat and microclimates in Chandler play a subtle but real role in how neighborhoods actually feel through the summer — some spots bake harder, others offer small pockets of relief through tree cover, water features, or elevation shifts.
Chandler’s Heat Baseline
Chandler shares the East Valley’s classic Sonoran Desert climate: summers averaging 105°F daytime highs from June through September, with 45+ days over 110°F projected annually by 2050 due to rising heat trends.
Nights cool to the 80s, but that trapped ground heat lingers, making mornings feel warmer than the thermometer says. Winters stay mild (60s–70s daytime), but we’re talking about surviving the long, intense summers here.
Microclimate Variations by Area
Chandler isn’t uniform — subtle differences in landscaping, water, pavement, and layout create noticeable “feels-like” shifts between corridors.
North & Central Chandler: Urban Heat Traps with Green Pockets
- More mature trees and neighborhood parks (like Desert Breeze) provide shade relief on walks or backyards, dropping perceived temps by 5–10°F under canopy.
- Asphalt-heavy commercial strips along Chandler Blvd and Ray Rd hold heat longer into evening — evenings here can feel stuffy even when the air cools.
Net feel: Everyday bearable with smart yard choices, but busier roads amplify the furnace effect.
South Chandler & Ocotillo: Water-Cooled Oasis
- Lakes, lagoons, and golf course water features in Ocotillo, Fulton Ranch, and The Islands create evaporative cooling — 3–7°F cooler microclimates near waterfront homes or paths.
- Dense palm-heavy landscaping and planned greenbelts wick away some heat, plus larger lots allow for pools and misters.
- Downside: Reflective stucco and tile roofs can radiate heat upward in unshaded spots.
Net feel: Most comfortable for outdoor living — patios stay livable longer, mornings feel fresher.
East Chandler: Exposed Desert Edge
- Closer to San Tan Mountains and Veterans Oasis, you get higher elevation (50–100 ft above central Chandler) and natural desert vegetation, which traps less radiant heat than manicured lawns.
- Open skies mean faster overnight cooling, but exposed sun means afternoons scorch without personal shade.
- Paseo Vista’s canal proximity adds a slight humidity buffer.
Net feel: Crisp evenings, brutal midday — rewards early birds and night owls.
West Chandler: Freeway & Development Heat
- Proximity to Loop 101/202 and denser retail means more concrete and vehicle exhaust, pushing “feels-like” temps 4–6°F higher during peak hours.
- Newer subdivisions have more drought-tolerant yards, but older areas with grass lawns stay wetter (and slightly cooler).
Net feel: Harshest in summer afternoons near arterials; quieter residential pockets breathe easier.
Practical Heat Navigation by Lifestyle
| Area | Peak Heat Driver | Cooling Perk | Best For |
|---|---|---|---|
| North/Central | Road pavement | Tree shade | Walkable routines |
| South/Ocotillo | Reflective surfaces | Lakes/evaporation | Patio dinners |
| East | Open exposure | Elevation/night cool | Early hikes |
| West | Freeway concrete | Modern xeriscaping | Pool homes |
Key strategies that work everywhere: Pools, misters, extended eaves, and desert yards cut indoor AC loads by 20–30%. Heat risk is citywide “extreme,” so everyone plans mornings/evenings outdoors.
If heat comfort is a big piece of your Chandler home puzzle — whether you crave Ocotillo’s lake breezes, east-side elevation, or just shade-smart north neighborhoods — let’s map it to your actual day-to-day. I’d be glad to walk through specific streets or listings and flag the microclimate details that match how you live. You don’t have to guess at summer feel alone; I’m here as your steady guide to find a spot where the heat works with you, not against you.
Get the full Phoenix Market Insights → [Market Insights]

-
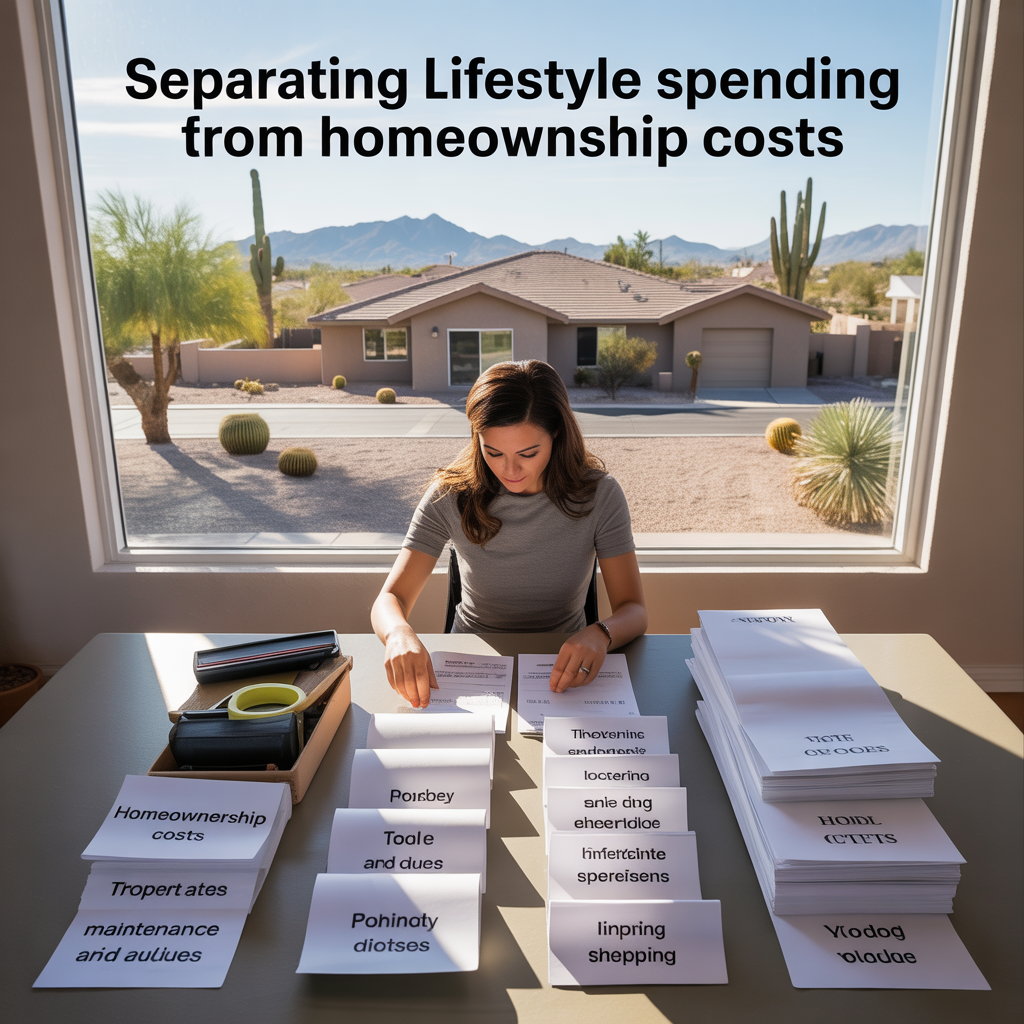
Separating Lifestyle Spending From Homeownership Costs
-
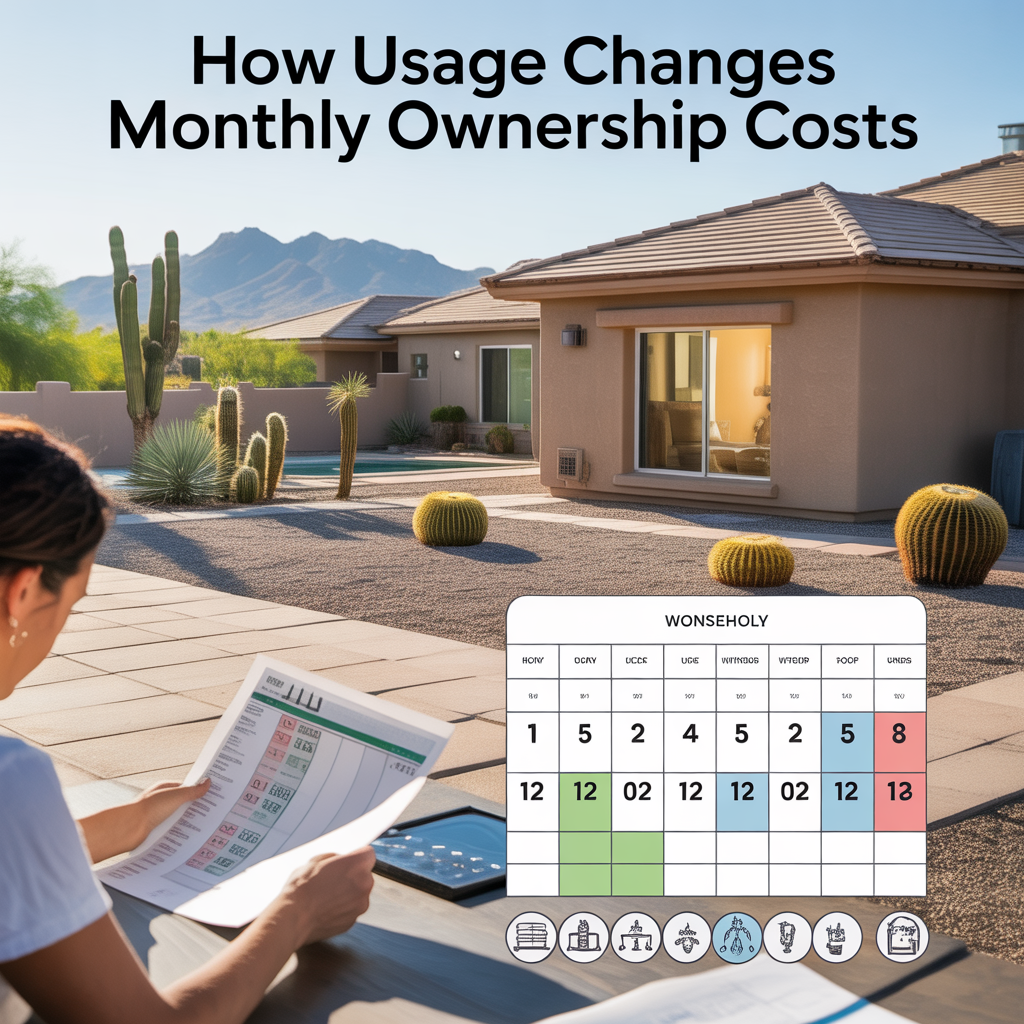
How Usage Changes Monthly Ownership Costs
-
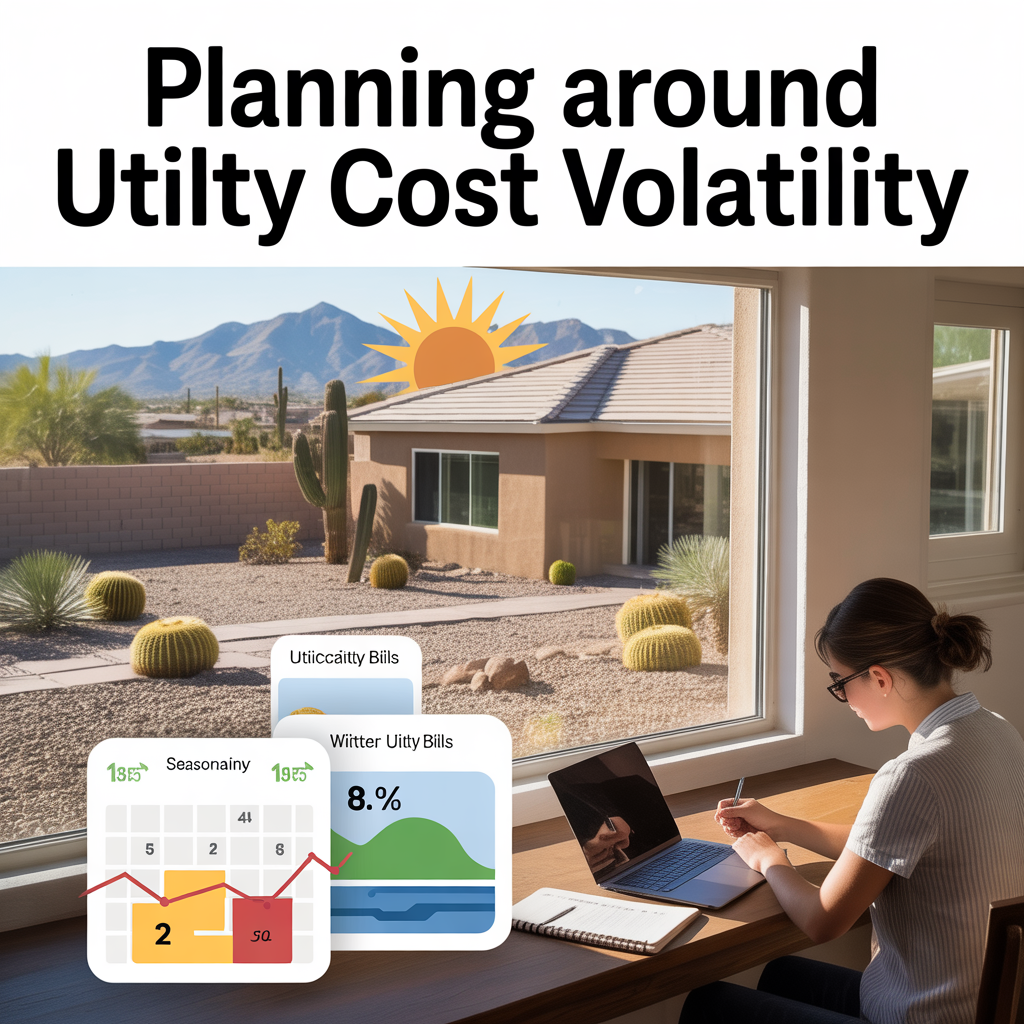
Planning Around Utility Cost Volatility
-
Why Variable Expenses Drive Most Budget Stress
-
Fixed Costs That Aren’t Actually Fixed
-
Budgeting for the House You’ll Own in Five Years
-
Why Ownership Cash Flow Feels Tighter Over Time
-
How Escrow Masks Long-Term Cost Growth
-
Why Your Mortgage Payment Isn’t Your True Housing Cost
-
Cross-Valley Trips: When They Feel Easy vs Heavy
-
Remote-Work Friendly Pockets in Glendale
-
School-Run Congestion Zones and Timing
-
Arterial Routing and “Daily Loop” Efficiency
-

State Farm Stadium and it’s Effect on Life and Property Value
-
Freeway Access as a Lifestyle Multiplier in Glendale
-

Event-Night Traffic Impacts and Avoidance Strategies
-

Weekday Commute Direction Tradeoffs From Glendale
-
Season Shifts in Outdoor Time in Glendale
-
Shade, Tree Cover, and Neighborhood Comfort
-

Dog and Kid Friendly Outdoor Routines
-
Trail Access That Feels Routine-Friendly
-
Sports Parks and Family Recreation Patterns
-
Map Proximity vs Summer Usability in Glendale
-
Daily-Use Parks vs Weekend Outdoor Trips
-

Top 10 “Date Night Out” Spots in Glendale