


Chandler Lifestyle Guide → [Chandler Lifestyle Guide] & For more info on Chandler Real Estate → [Chandler Real Estate Guide]
Written by: Renee Burke
I remember driving through Chandler about a decade ago, noticing how the city felt like it was just on the cusp of something special. The Intel campus was humming, but downtown still had that quiet, end-of-day charm with just a handful of local spots to grab coffee or dinner. Fast forward to today, and Chandler has matured into one of the Southeast Valley’s most sought-after communities — not overnight, but through steady, thoughtful growth. If you’re curious about what’s shifted in the real estate landscape here over the last 10 years, let’s walk through it together, step by step.
I’ve watched these changes unfold firsthand, helping families navigate them along the way. What stands out most is how Chandler transformed from a solid suburban option into a resilient, high-demand market that balances lifestyle, jobs, and value in a way few places do.
The Early Years: Recovery and Quiet Momentum (2016–2019)
Around 2016, Chandler was still shaking off the last echoes of the Great Recession. Home prices had bottomed out a few years earlier, but the recovery was gentle — median values hovered right around $300,000 to $350,000 for a typical single-family home. Inventory was decent, with homes lingering 60–90 days on the market, giving buyers breathing room to negotiate.
What set Chandler apart even then was its economic anchor. Intel’s ongoing expansions brought in engineers and families who wanted more than just a roof — they sought community. Neighborhoods like Fulton Ranch and Ocotillo started drawing attention for their master-planned appeal, with lakes, golf courses, and trails that felt like a step up from standard suburbs. Schools in Chandler Unified were already earning top marks, pulling in families from across the Valley.
By 2019, things began to warm up. Prices climbed to about $400,000 median, fueled by low interest rates and a surge in tech jobs. Demand picked up, but it wasn’t frantic yet — more like a steady hum. Sellers started seeing multiple offers, especially on updated homes near Price Road, but the market stayed balanced.
The Pandemic Pivot: Boom and Transformation (2020–2022)
Then came 2020, and everything accelerated. Remote work changed the game overnight. Families from California, Washington, and even the Midwest discovered Chandler’s appeal: affordable compared to coastal markets, sunny weather, and that perfect mix of urban access via Loop 202 without big-city chaos. Median prices jumped to $450,000 by late 2020, then rocketed past $500,000 in 2021.
Inventory evaporated — we’re talking under a month on market for well-priced homes. Bidding wars became the norm, especially in family pockets like Andersen Springs or newer builds off Ray Road. Developers couldn’t keep up; Chandler’s buildable land was already scarce, pushing buyers toward resales. Rental demand exploded too, with median rents climbing from $1,500 to over $2,000 for a three-bedroom.
Downtown Chandler transformed during this time. What was once a sleepy strip evolved into a vibrant hub — think more farm-to-table spots, breweries like Strive, and events at Dr. A.J. Chandler Park drawing crowds. This wasn’t just cosmetic; it built equity into surrounding neighborhoods as walkability became a premium feature.
Stabilization and Maturity (2023–2026)
By 2023, the frenzy eased as rates rose and buyers paused. Median prices peaked around $550,000–$575,000, but then softened to about $520,000–$530,000 today. That’s a healthy correction — down 3–7% year-over-year recently — but still more than double 2016 levels. Homes now take 45–60 days to sell, with 2–3 offers on desirable properties. It’s competitive, but not cutthroat.
Price per square foot has held steady at $280–$290, reflecting quality upgrades across the board. Newer developments like Larkin and Peyton Place emphasize smart-home features and energy efficiency, appealing to hybrid workers. Meanwhile, established areas like Downtown Chandler and Ocotillo have seen infill projects — renovated mid-century homes and luxury townhomes — adding polish without overbuilding.
Rental market? Stronger than ever. Median rents sit at $2,400 now, up from $1,800 five years ago, with low vacancy rates thanks to Intel, NXP, and incoming remote professionals. Investors love the cash flow stability here.
Key Market Metrics: A 10-Year Snapshot
Here’s a clear view of the shifts, based on trends I’ve tracked closely:
| Year Range | Median Home Price | Days on Market | YoY Appreciation | Inventory Level |
|---|---|---|---|---|
| 2016–2019 | $300K–$400K | 60–90 days | 4–6% | Moderate |
| 2020–2022 | $450K–$575K | 15–30 days | 15–25% | Very Low |
| 2023–2026 | $520K–$550K | 45–62 days | 2–4% | Balanced |
Appreciation has averaged 6–8% annually over the decade, outpacing national averages, thanks to job growth and limited supply. Seller’s market in the boom years flipped to neutral now, favoring buyers with patience.
What Drove the Changes?
A few threads tie this evolution together:
- Job Growth: Tech expansions (Intel’s fab plants, Microchip) added 10,000+ high-wage jobs, sustaining demand.
- Infrastructure: Loop 202 widening and Price Corridor upgrades cut commutes, making Chandler a gateway to Phoenix, Tempe, and Scottsdale.
- Lifestyle Upgrades: Parks like Veterans Oasis expanded, and events like Ostrich Festival grew, turning Chandler into a destination.
- Demographics: Influx of 30–50-year-olds seeking space post-pandemic, plus retirees eyeing low-maintenance options.
- Supply Constraints: Nearly built-out, shifting focus to quality resales and renovations.
Misconception I hear often: “Chandler’s growth is done.” Not true — it’s just matured. Values hold firm because fundamentals are rock-solid.
Neighborhood Spotlights: Winners and Evolvers
- Ocotillo: From luxury outlier to family staple; prices up 150% as amenities shone.
- Downtown Chandler: Revived with lofts and eateries; now a hot rental spot.
- Fulton Ranch: Tech exec haven; steady appreciation from planned elegance.
- Emerging East Side: Affordable entry points then; now established with rising values.
These shifts highlight how Chandler rewards long-term holders — early buyers saw life-changing equity.
Challenges Along the Way
No story’s perfect. The 2022–2023 slowdown tested sellers, with some over-lists sitting longer. Water concerns and summer heat sparked hesitation, but Chandler’s proactive planning — recycled water, green belts — addressed them. Rates climbing to 7% cooled migration temporarily, yet locals stayed loyal.
The Bigger Picture
Over 10 years, Chandler real estate evolved from post-recession rebound to boom-time star, now settling into reliable maturity. Cumulative appreciation nears 80–100%, with lower risk today. It’s a market that’s grown up thoughtfully, mirroring the families and professionals who call it home.
If you’re reflecting on your own moves or eyeing Chandler now, these changes show why it’s worth the conversation.
A Thoughtful Next Step
Every market shift brings new opportunities, and Chandler’s story is one of enduring strength. I’ve guided dozens through these exact changes, from boom buys to today’s smart positioning.
If you’re thinking about making a move in Phoenix, you don’t have to figure it out alone.
Reach out — let’s chat about what this means for you. I’m here.
Get the full Phoenix Market Insights → [Market Insights]

-
Separating Lifestyle Spending From Homeownership Costs
-
How Usage Changes Monthly Ownership Costs
-
Planning Around Utility Cost Volatility
-
Why Variable Expenses Drive Most Budget Stress
-
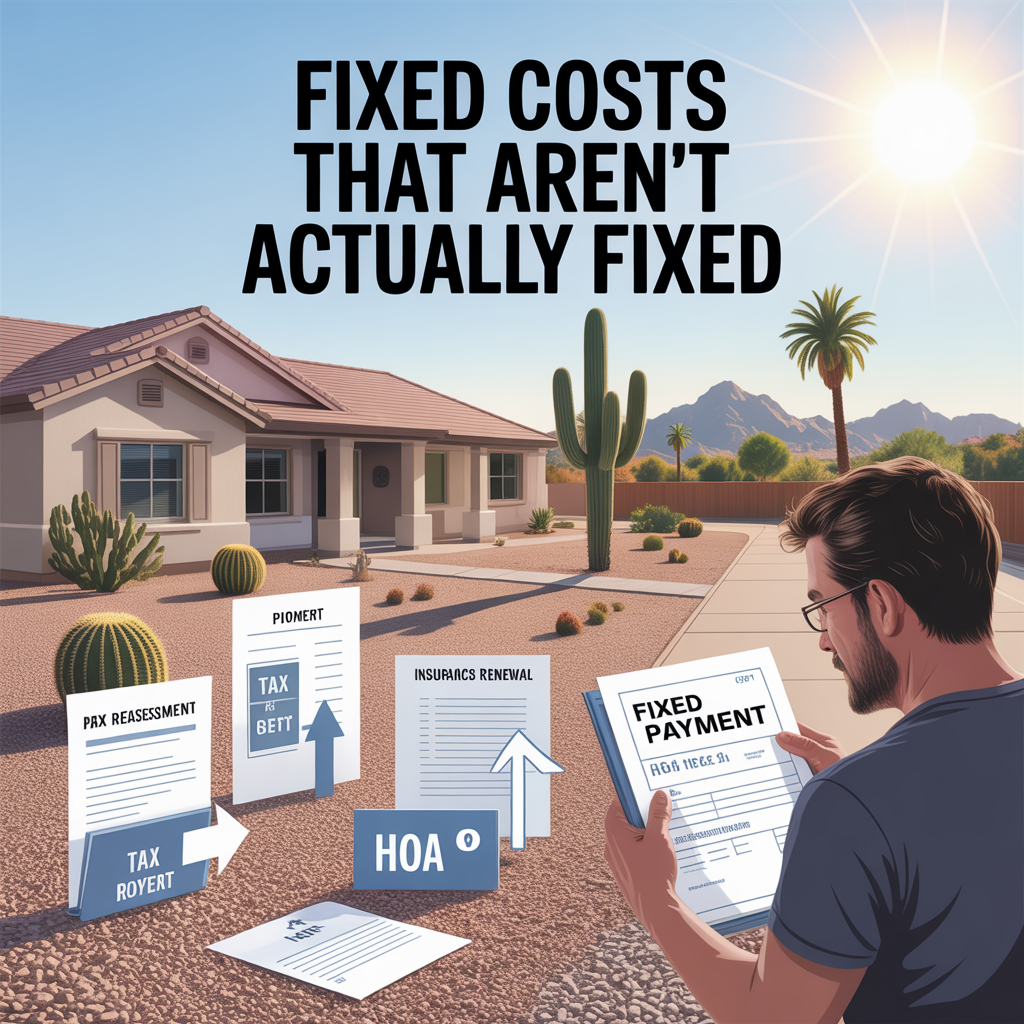
Fixed Costs That Aren’t Actually Fixed
-
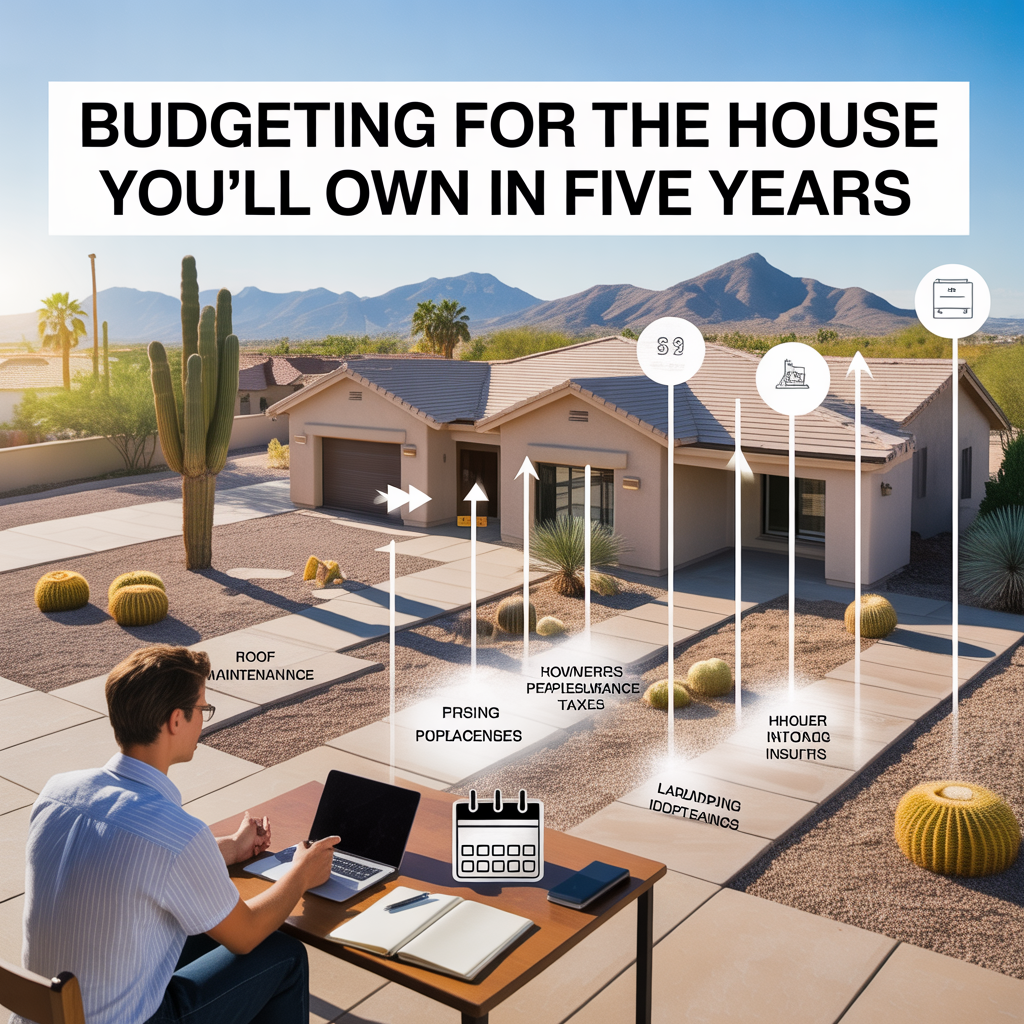
Budgeting for the House You’ll Own in Five Years
-
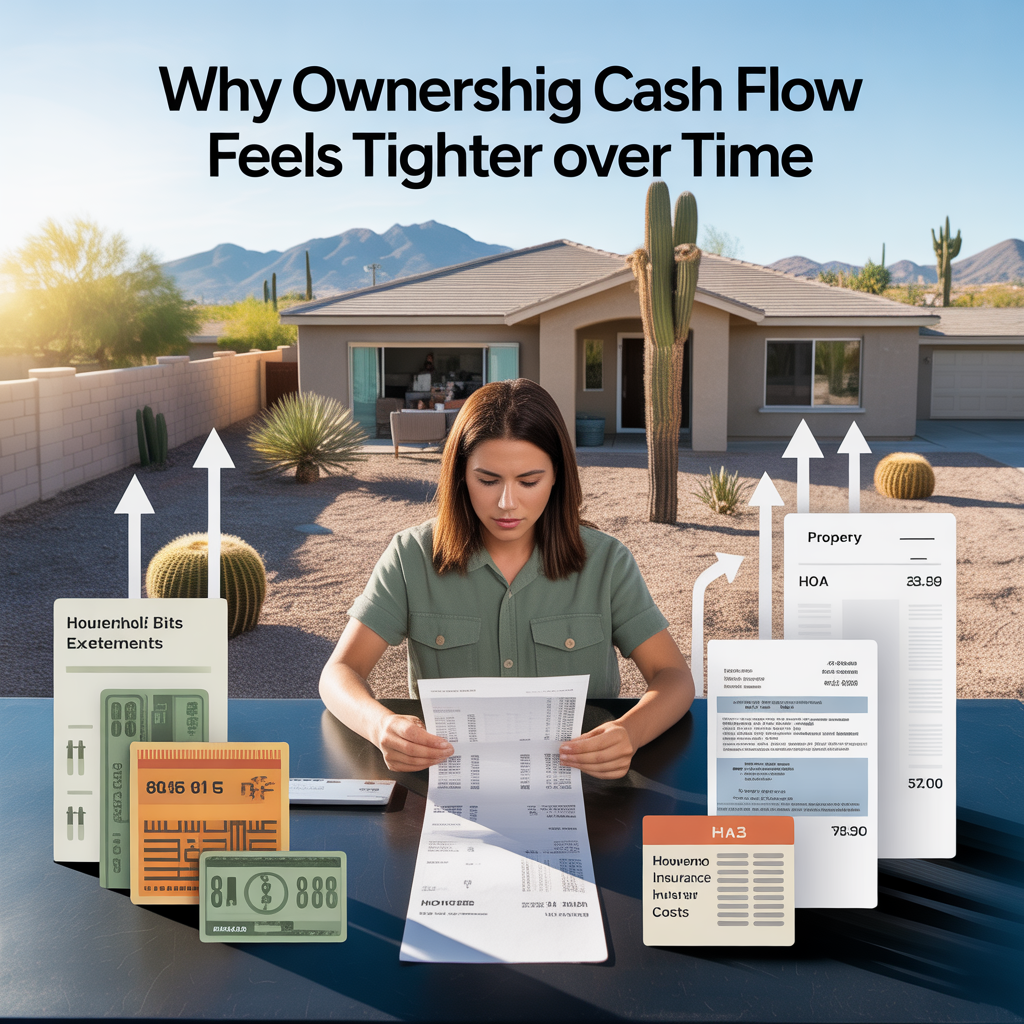
Why Ownership Cash Flow Feels Tighter Over Time
-
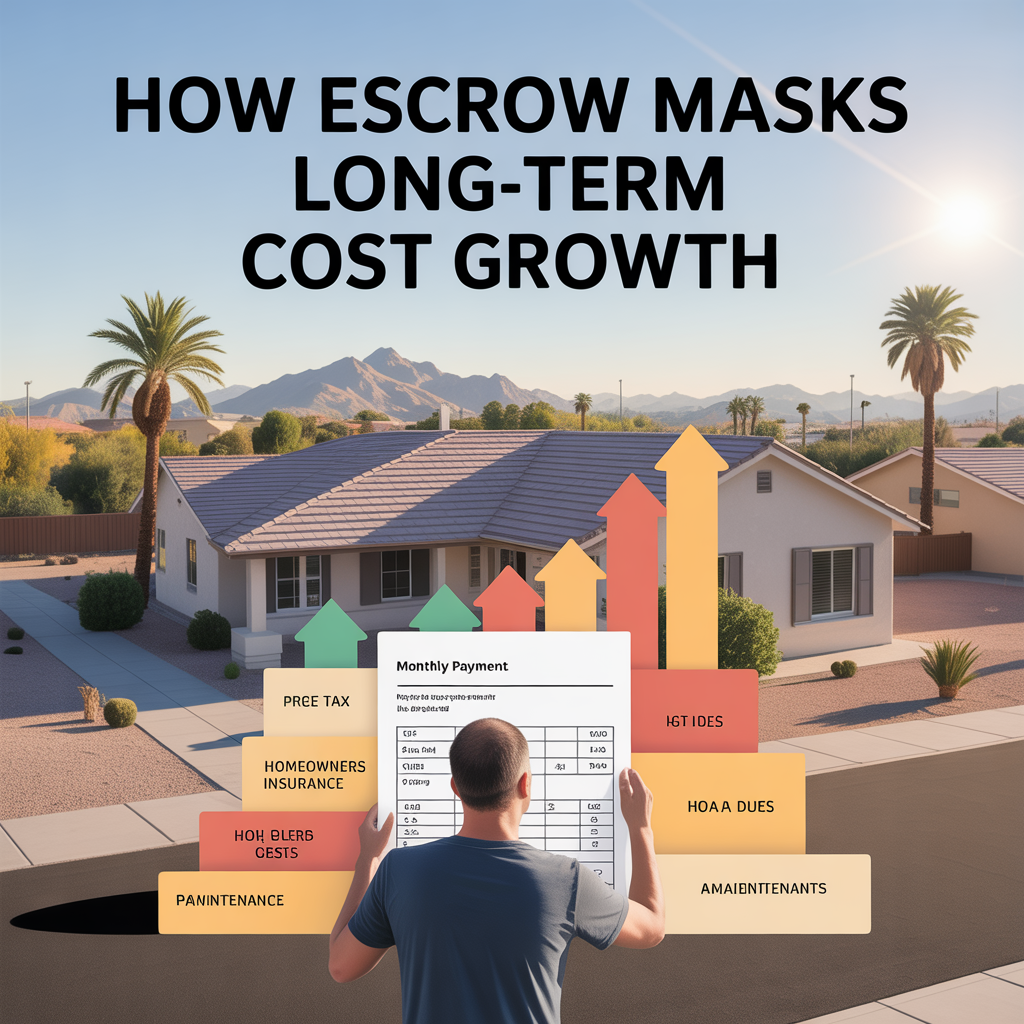
How Escrow Masks Long-Term Cost Growth
-
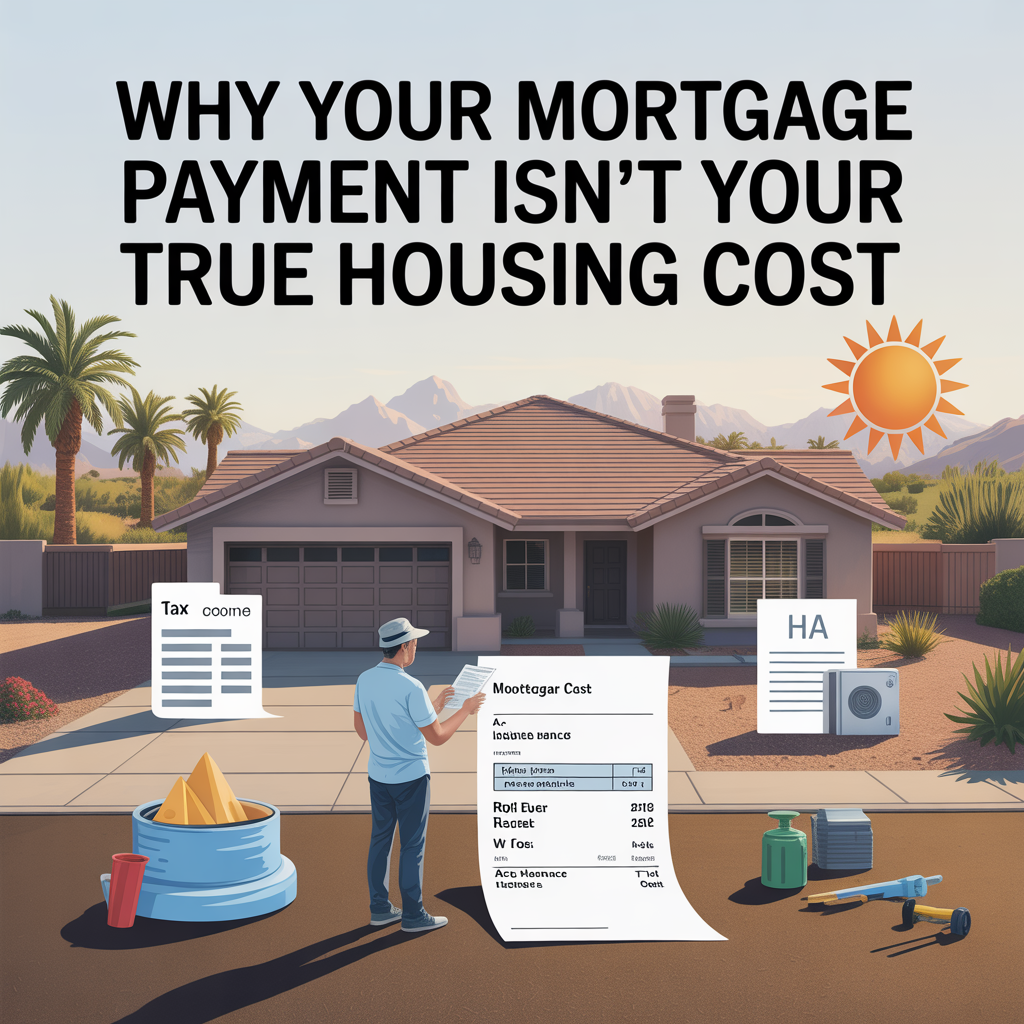
Why Your Mortgage Payment Isn’t Your True Housing Cost
-
Cross-Valley Trips: When They Feel Easy vs Heavy
-
Remote-Work Friendly Pockets in Glendale
-
School-Run Congestion Zones and Timing
-
Arterial Routing and “Daily Loop” Efficiency
-

State Farm Stadium and it’s Effect on Life and Property Value
-
Freeway Access as a Lifestyle Multiplier in Glendale
-
Event-Night Traffic Impacts and Avoidance Strategies
-
Weekday Commute Direction Tradeoffs From Glendale
-
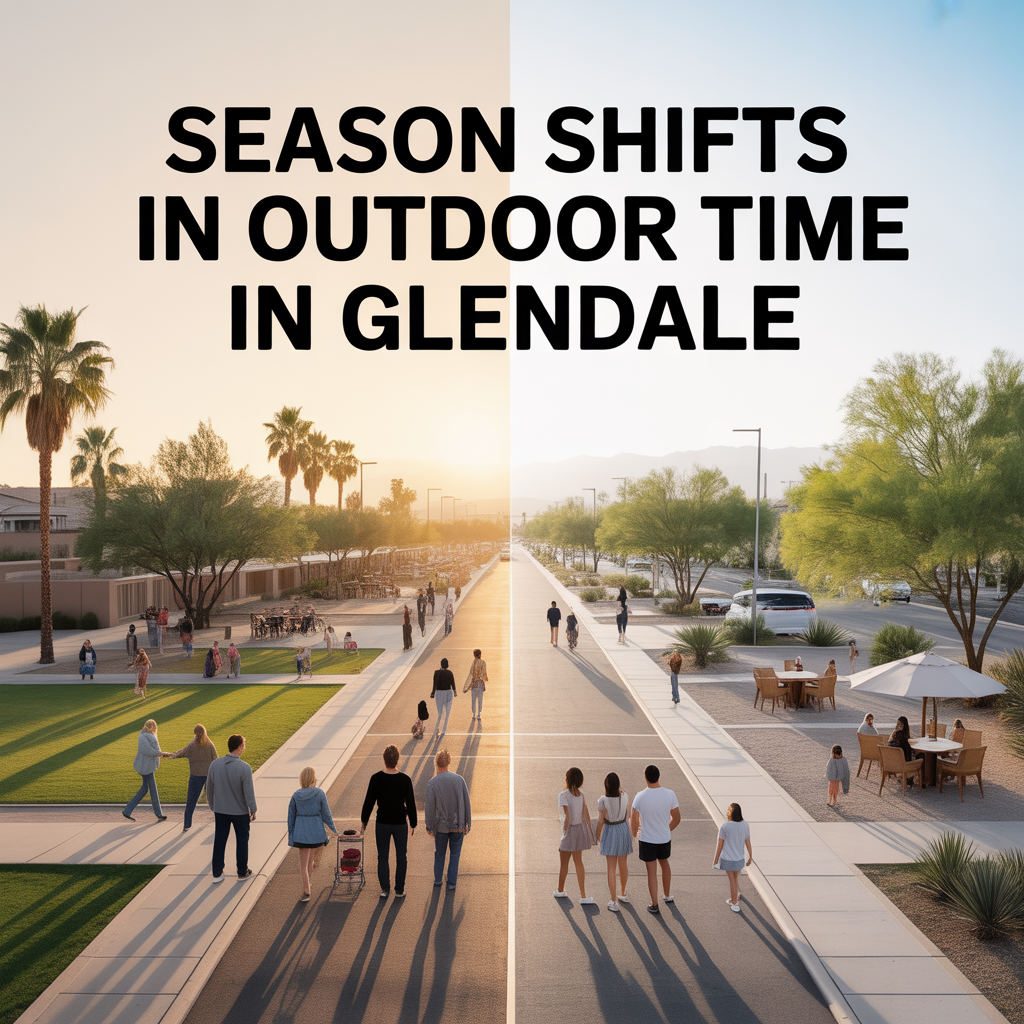
Season Shifts in Outdoor Time in Glendale
-
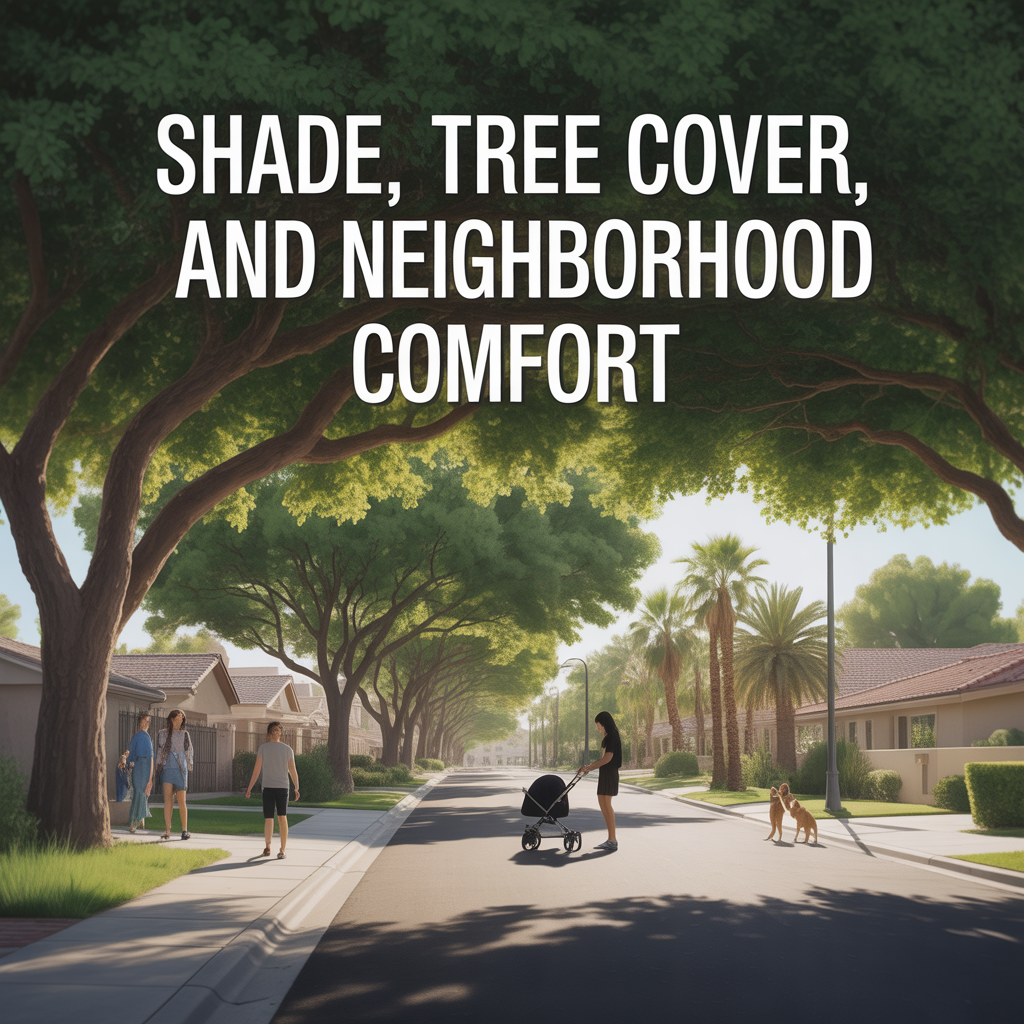
Shade, Tree Cover, and Neighborhood Comfort
-

Dog and Kid Friendly Outdoor Routines
-

Trail Access That Feels Routine-Friendly
-
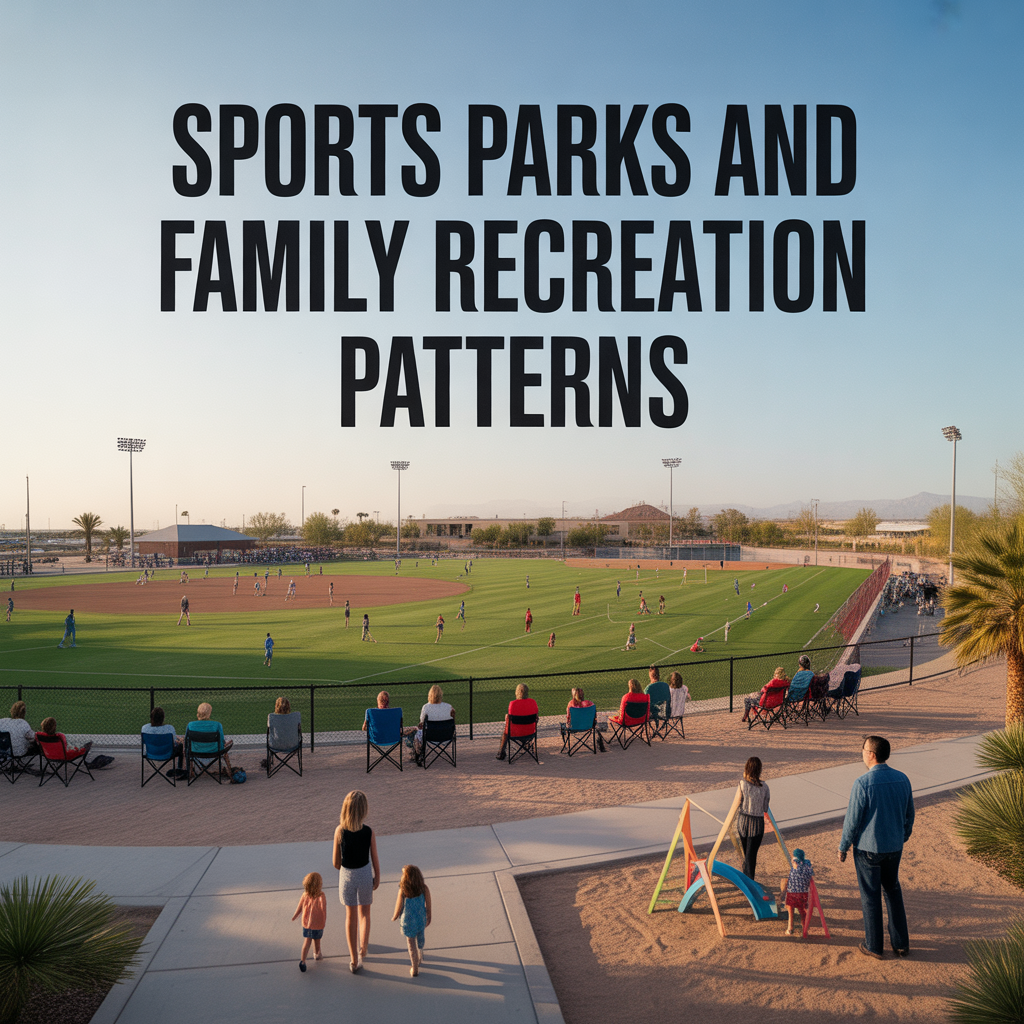
Sports Parks and Family Recreation Patterns
-
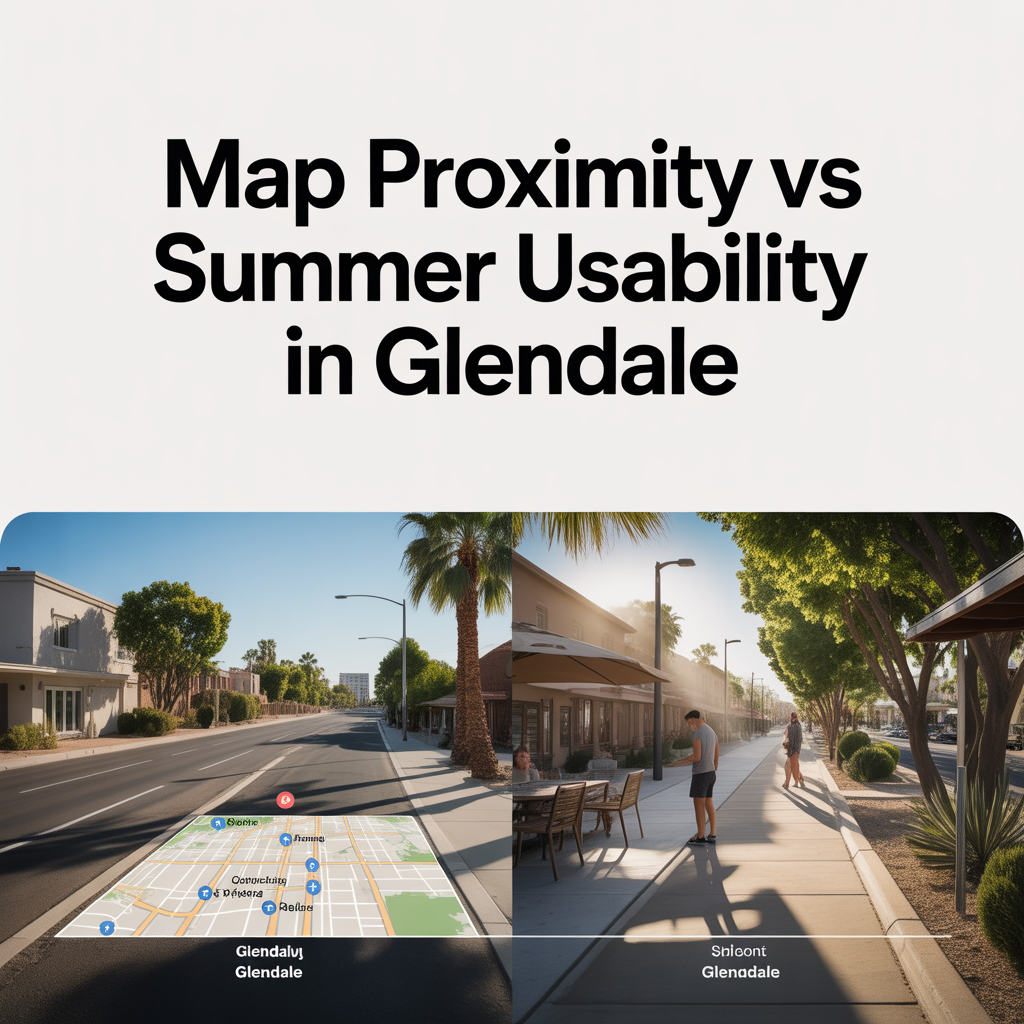
Map Proximity vs Summer Usability in Glendale
-

Daily-Use Parks vs Weekend Outdoor Trips
-

Top 10 “Date Night Out” Spots in Glendale