



Chandler Lifestyle Guide → [Chandler Lifestyle Guide] & For more info on Chandler Real Estate → [Chandler Real Estate Guide]
Written by: Renee Burke
Yes, Chandler stands as a solid choice for homebuyers in early 2026, offering stable appreciation potential amid a cooling market that favors negotiators over frantic bidders. Median prices dipped to around $523,000 last month, down 7% year-over-year, with homes lingering 62 days—longer than last year’s 53—giving you breathing room to find value without FOMO frenzy. As your East Valley guide who’s walked families through these shifts, I see this as a gentle entry point: strong schools, Intel jobs, and lifestyle perks hold long-term appeal, even as rates hover and inventory ticks up slightly.
Current Market Snapshot
Chandler’s housing softened into buyer-friendly territory after 2025’s peaks, with Redfin logging 236 sales in December—up from 197—yet prices per square foot eased to $287, down 2%. Zillow pegs typical values at $517,000, a 3.2% annual slide, signaling stabilization rather than crash—resales outperform new builds, which dropped 21% amid incentive wars. Inventory grows modestly (2-3 months’ supply), competition eases to 2 offers average, and days-on-market stretch, letting you haggle 2-5% off list in North Fulton Ranch townhomes or South Ocotillo fixers.
Rates around 6.5% improve affordability versus 2024’s 7.5%, pairing with steady $110,000 median incomes to keep payments manageable—$3,300/month on a $500K home with 20% down. Rentals hover $2,400 for 3-beds, tempting investors eyeing 4-5% yields Downtown. Forecasts whisper moderate growth (2-4%) through 2027, fueled by tech expansion, not speculation.
Why Buy Now? Key Advantages
Timing favors the prepared. Prices bottomed post-rate hikes, yet fundamentals shine: Intel’s campus pumps demand north of Warner, schools like Basha rank top-tier statewide, and amenities—Ocotillo lakes, Tumbleweed sports—nurture families long-haul. Appreciation averaged 5% yearly pre-correction, outpacing inflation, with resale values resilient even in dips.
Neighborhood gems abound: $450K East rural starters offer orchards and space; $600K North gated pools buffer summers; $700K South estates deliver resort golf. Negotiate closing costs or upgrades—sellers motivate amid longer DOM. Low inventory (23K Valley-wide) prevents oversupply crash, and tax perks (0.7% rate) sweeten equity builds.
Potential Drawbacks to Weigh
No market’s perfect. Summer heat shrinks curb appeal tours, monsoons delay closings, and arterials like Arizona Avenue clog Intel rushes—test commutes. New-build slowdowns mean fewer incentives, though resales flex more. Affordability strains first-timers without $100K down, and while stable, short-term flips lag hotter Gilbert spots.
Competition lingers in sub-$500K pockets, but 62 DOM buys time. HOA fees ($100-300/month) gate luxury but rule rigidly.
Neighborhood Buying Sweet Spots
Long-Term Outlook and Advice
Chandler thrives for 5-10+ year holds—tech corridor cements demand, population swells 2%/year, infrastructure (Loop 202 expansions) future-proofs. Values rebound mid-2026 as rates potentially dip to 6%, per forecasts. Risks minimal: no bubble burst, diversified economy.
Crunch numbers: aim 20% down, lock rates soon, inspect monsoon-ready roofs. Test seasonally—winter walks, summer AC. Partner with locals navigating incentives.
Chandler welcomes thoughtful buyers—stable, sunny, yours to claim.
If you’re thinking about making a move in Phoenix, you don’t have to figure it out alone — reach out anytime, and I’ll guide you through the details with the care you deserve.
Get the full Phoenix Market Insights → [Market Insights]


-

Shade Coverage and Tree Canopy Differences by Corridor
-

Summer Walkability Reality Near ASU and Mill Avenue
-

Choosing Proximity Based on Personality and Routine
-

How Tempe Town Lake Changes Social Routines
-
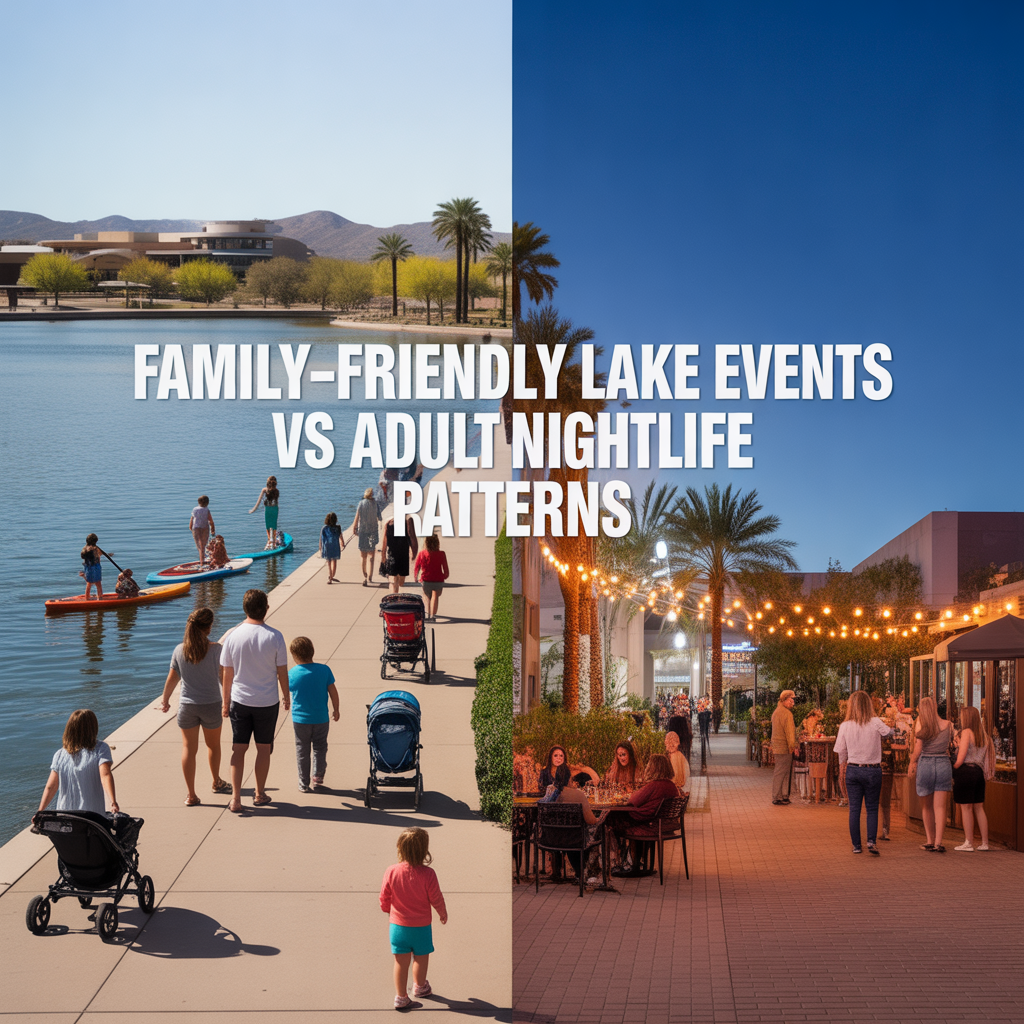
Family-Friendly Lake Events vs Adult Nightlife Patterns
-

Parking Structures and Rideshare Realities on Peak Nights
-
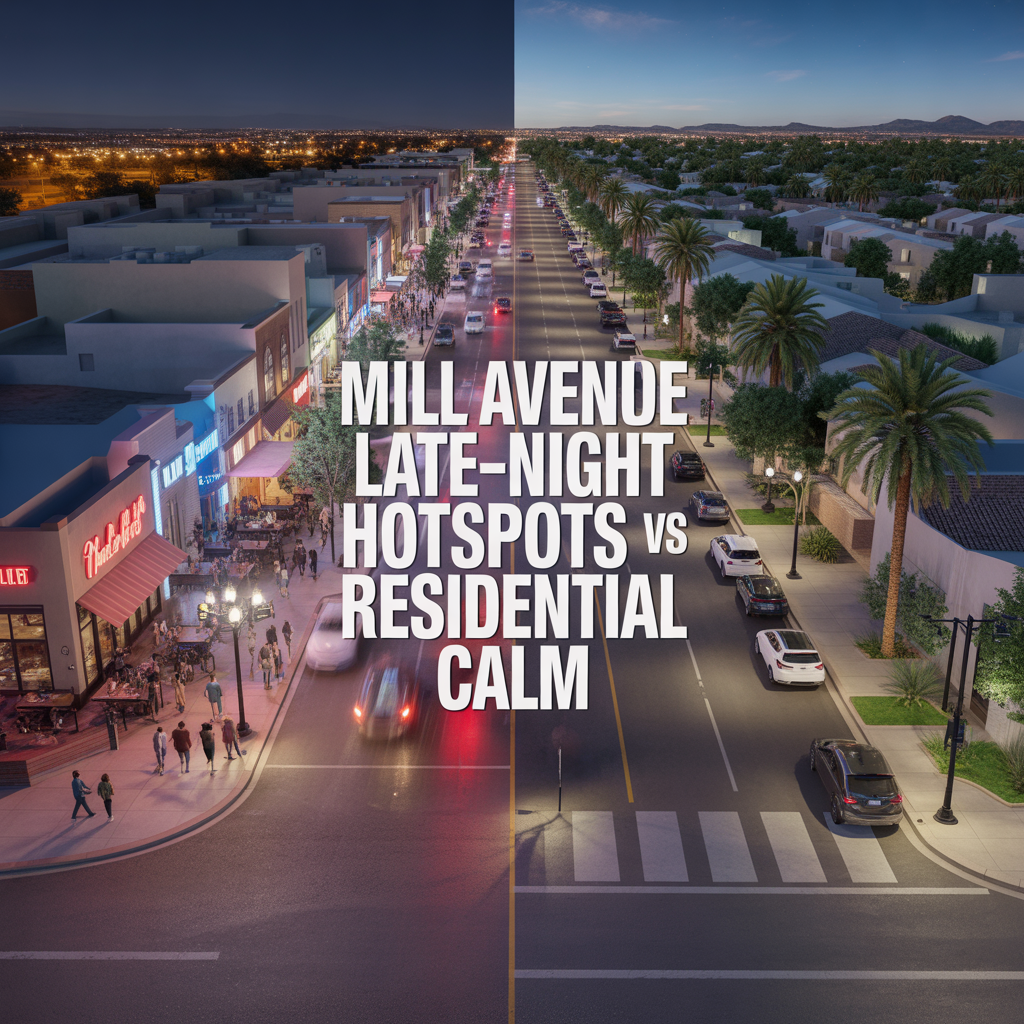
Mill Avenue Late-Night Hotspots vs Residential Calm
-

ASU Game Days and Event Calendar Impacts
-

Cross-Valley Trip Efficiency From Tempe
-

Micro-Mobility and Bike Utility by Corridor
-

Park-And-Ride, Game Day, and Event Access Patterns
-

Airport Timing Strategy Around ASU and Rush Hour Traffic
-

Light Rail Use Cases That Actually Improve Daily Life
-

Freeway vs Arterial Routing During Peak Windows
-

Real-World Drive Times to Sky Harbor From Different Tempe Pockets
-

How Traffic and Commute Direction Affect Daily Life in North vs South Tempe
-

Bike Paths, Walkability, and Short-Distance Transportation in Tempe
-

Driving Access From Tempe to Phoenix Sky Harbor Airport
-

Light Rail Access Between Tempe, Downtown Phoenix, and Mesa
-

Major Tempe Arterial Roads Including Rural Road, McClintock Drive, and Baseline Road
-

ASU Traffic Patterns and Peak Congestion Near Campus
-

Typical Commute Times From Tempe to Phoenix, Scottsdale, and Chandler
-
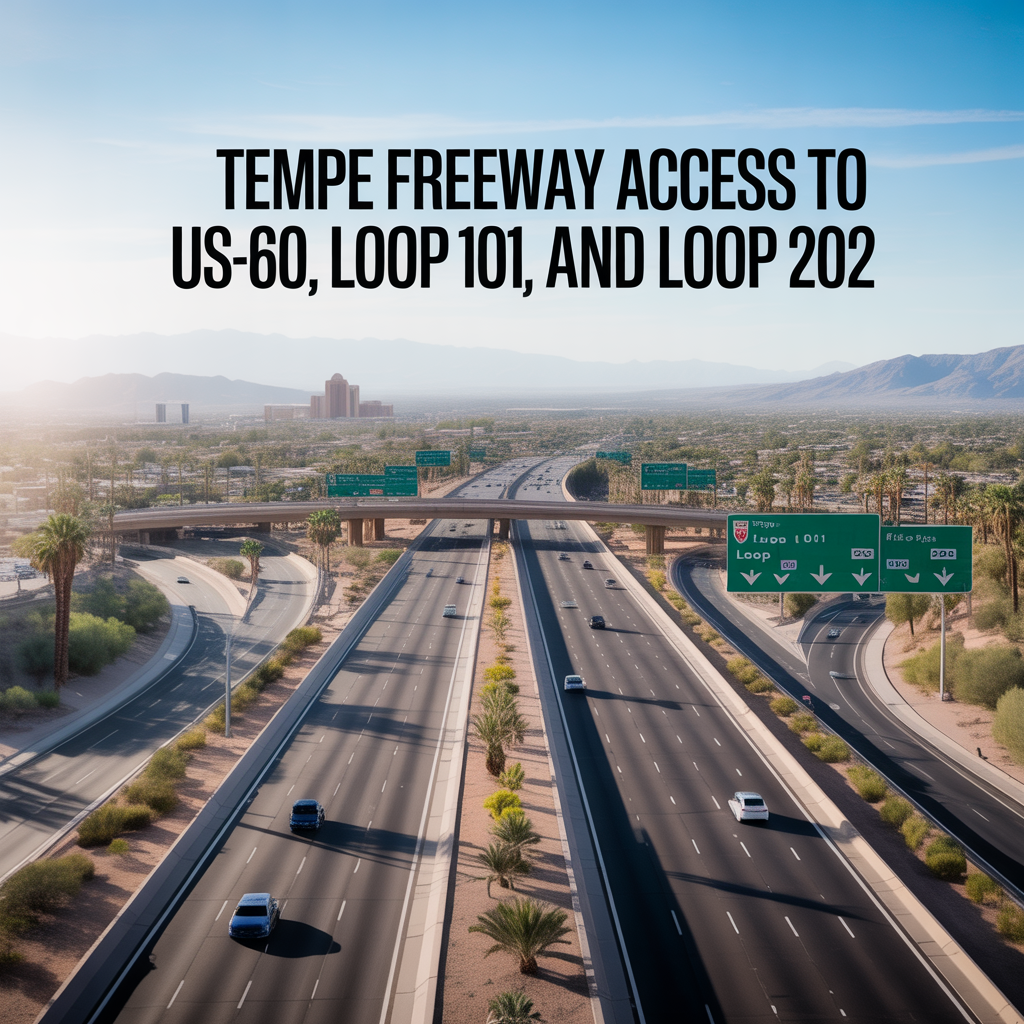
Tempe Freeway Access to US-60, Loop 101, and Loop 202
-

Shade, Tree Coverage, and Summer Outdoor Usability in Tempe
-

Outdoor Recreation Near Downtown Tempe and ASU