


Chandler Lifestyle Guide → [Chandler Lifestyle Guide] & For more info on Chandler Real Estate → [Chandler Real Estate Guide]
Written by: Renee Burke
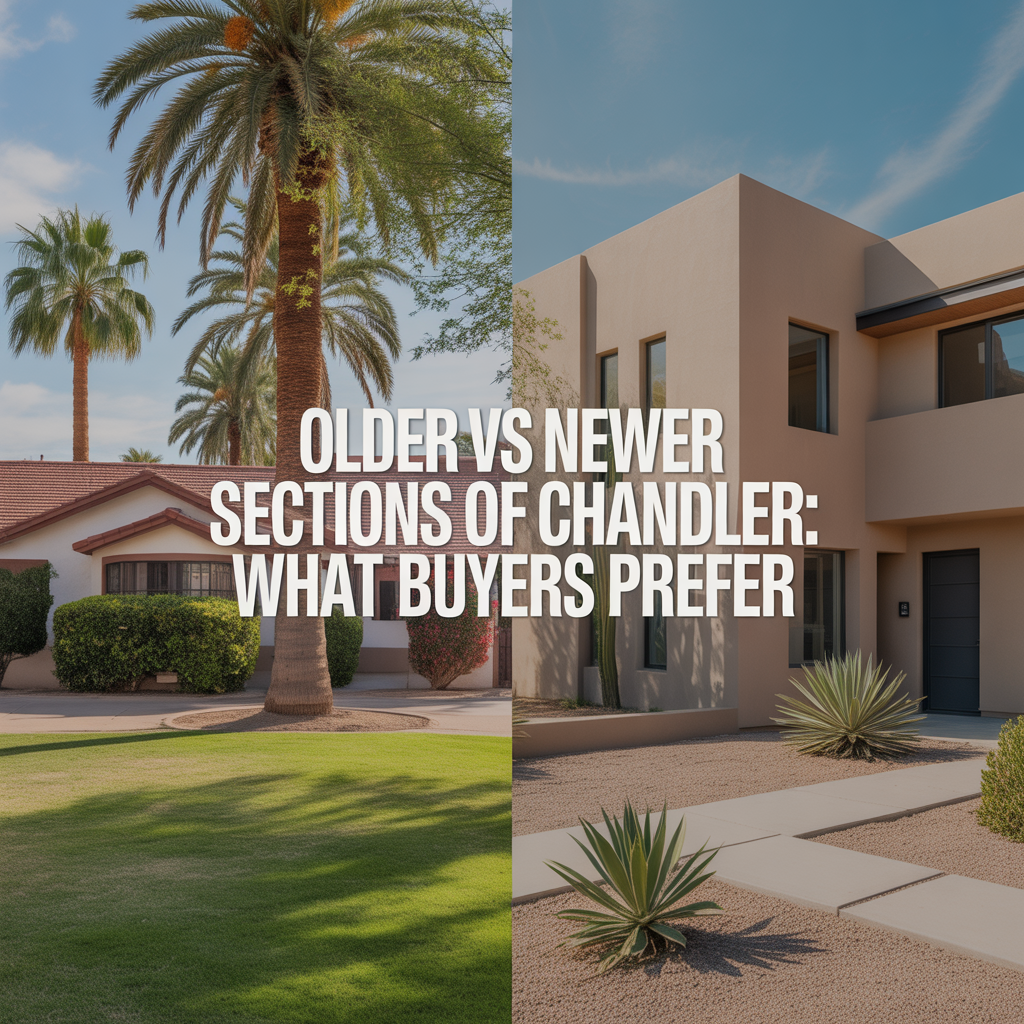
North Chandler’s established neighborhoods and South Chandler’s polished master-planned communities each hold a special pull for buyers, like choosing between a cozy family quilt or a crisp set of new linens—both comforting, just in different ways. I’ve seen preferences shift over my years here in the East Valley, with families weighing mature charm against modern ease, all while eyeing Intel commutes and San Tan sunsets. Today in 2026, buyers lean slightly toward newer southside spots for their turnkey appeal, but older north areas win hearts (and value) for those craving authenticity and space—let’s see why both shine.
Older North Chandler: Established Roots, Timeless Value
North of the Loop 101—think Andersen Springs, The Provinces, or downtown edges—older sections (1970s-1990s builds) draw buyers who love Chandler’s agricultural soul: ranch homes on 7,000-10,000 sq ft lots shaded by citrus and mesquite, no-HOA freedom, and streets alive with kids’ bikes and neighbor chats. Prices land gentler ($450K-$650K for 2,000-2,800 sq ft), offering more square footage per dollar than southside premiums.
Buyers flock here for walkability to Tumbleweed Park concerts, Knox Gifted Academy proximity, and that organic feel—less cookie-cutter, more character. Updates like quartz refreshes add pop, but many embrace the bones: block construction holds up in our heat, and larger yards suit playdates or gardens. It’s a favorite for first families, downsizers, or anyone valuing history over warranties, with steady 3-4% appreciation in a market favoring affordability.
Newer South Chandler: Modern Polish, Resort Ease
South of Loop 202—in Ocotillo, Fulton Ranch, Layton Lakes (2000s-newer)—buyers snag sleek efficiency: 3,000+ sq ft homes ($700K-$1.2M+) with spray-foam insulation, leased solar slashing SRP bills, and HOA perks like lagoons, trails, and clubhouses. Tighter lots (5,000-7,000 sq ft) trade space for low-maintenance bliss—pebble pools, casitas, and smart tech standard.
This draws tech pros (5-10 mins to Price Corridor), growing households (Basha High excellence), and empty-nesters craving resort vibes without Scottsdale tabs. Primary suites feel like spas; community events fill weekends. It’s top choice for 60% of my recent buyers seeking move-in magic, though HOAs ($100-$300/mo) and uniformity aren’t for all—appreciation edges higher (4-6%) on limited land.
What Buyers Prefer—and Why It Varies
Newer south wins for speed: 40-55 days on market vs. north’s 65-75, luring relocators who prioritize warranties, energy savings, and polished patios for Arizona entertaining. But older north steals for value—$100-$150 less/sq ft, bigger lots, and that “roots-down” permanence families cherish near Loop 101 Phoenix runs (20-25 mins).
Preferences split by life stage: young pros/families tilt south (modern flex spaces); multigen or budget-savvy lean north (space, no fees). Both offer Chandler Unified A+ schools, safe streets, and Loop 202 ease—north feels like a hug from the past, south a breath of fresh desert air.
Your Chandler Sweet Spot
Stroll Andersen Springs’ shade, then Fulton Ranch’s trails—your rhythm decides. Older delivers bang-for-buck longevity; newer, hassle-free horizons. In our balanced 2026 market ($516K medians), both build equity beautifully.
If you’re thinking about making a move in Chandler — or anywhere in the greater Phoenix area — you don’t have to figure it out alone. Whether north’s charm or south’s shine calls to you, I’d love to help weigh what fits your days, honestly and at your pace.
Sometimes the best next step is simply a conversation about your must-haves, the trade-offs that feel right, and the Chandler gem waiting for you. When you’re ready, I’m here — to listen, to guide, and to help you land with complete confidence.
Get the full Phoenix Market Insights → [Market Insights]

-
Separating Lifestyle Spending From Homeownership Costs
-
How Usage Changes Monthly Ownership Costs
-
Planning Around Utility Cost Volatility
-
Why Variable Expenses Drive Most Budget Stress
-
Fixed Costs That Aren’t Actually Fixed
-
Budgeting for the House You’ll Own in Five Years
-
Why Ownership Cash Flow Feels Tighter Over Time
-
How Escrow Masks Long-Term Cost Growth
-
Why Your Mortgage Payment Isn’t Your True Housing Cost
-
Cross-Valley Trips: When They Feel Easy vs Heavy
-
Remote-Work Friendly Pockets in Glendale
-
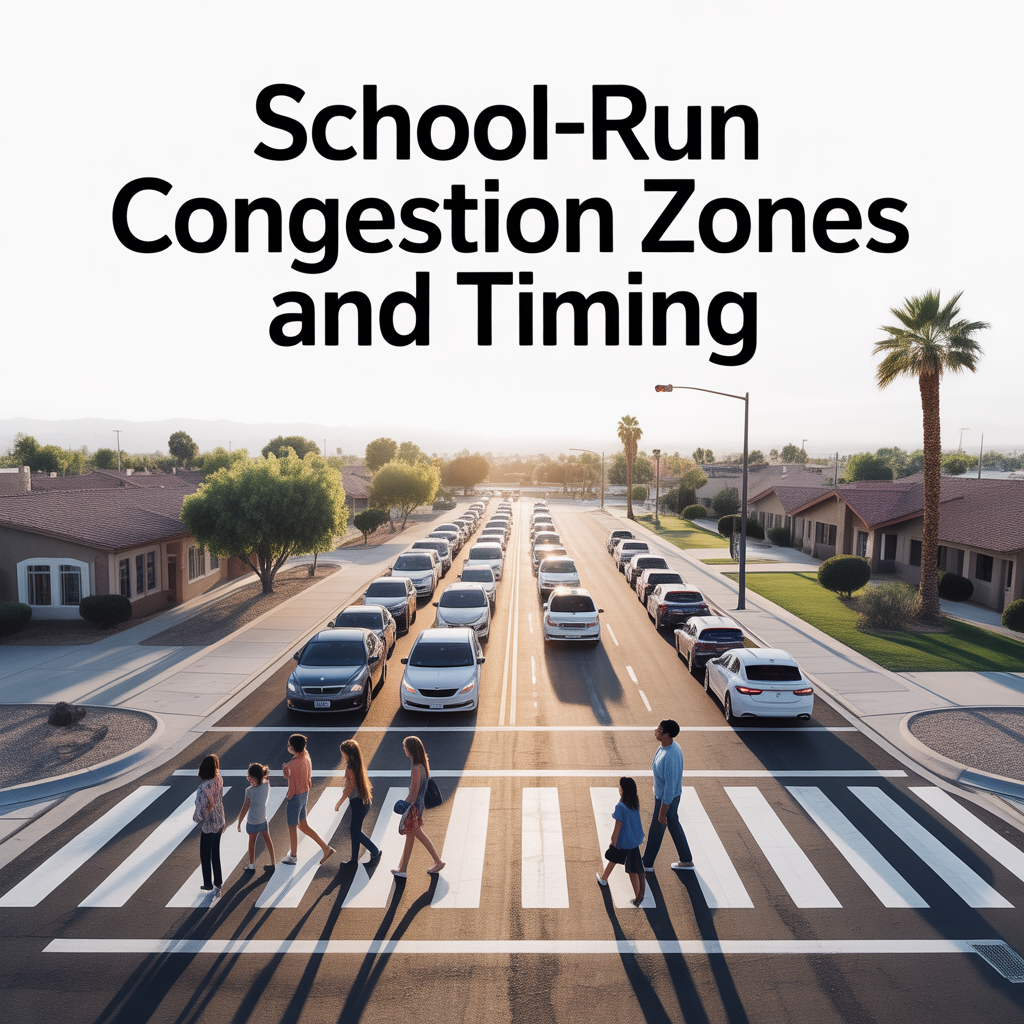
School-Run Congestion Zones and Timing
-
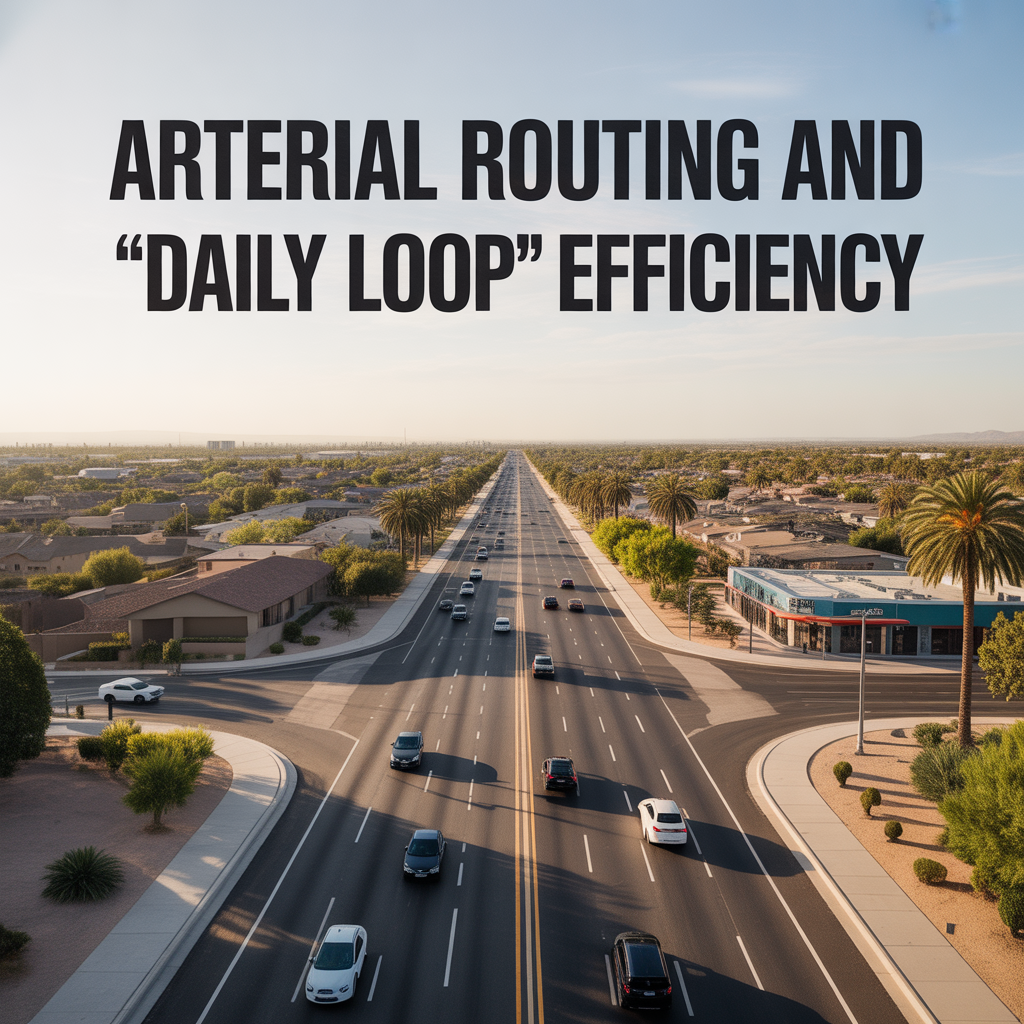
Arterial Routing and “Daily Loop” Efficiency
-

State Farm Stadium and it’s Effect on Life and Property Value
-
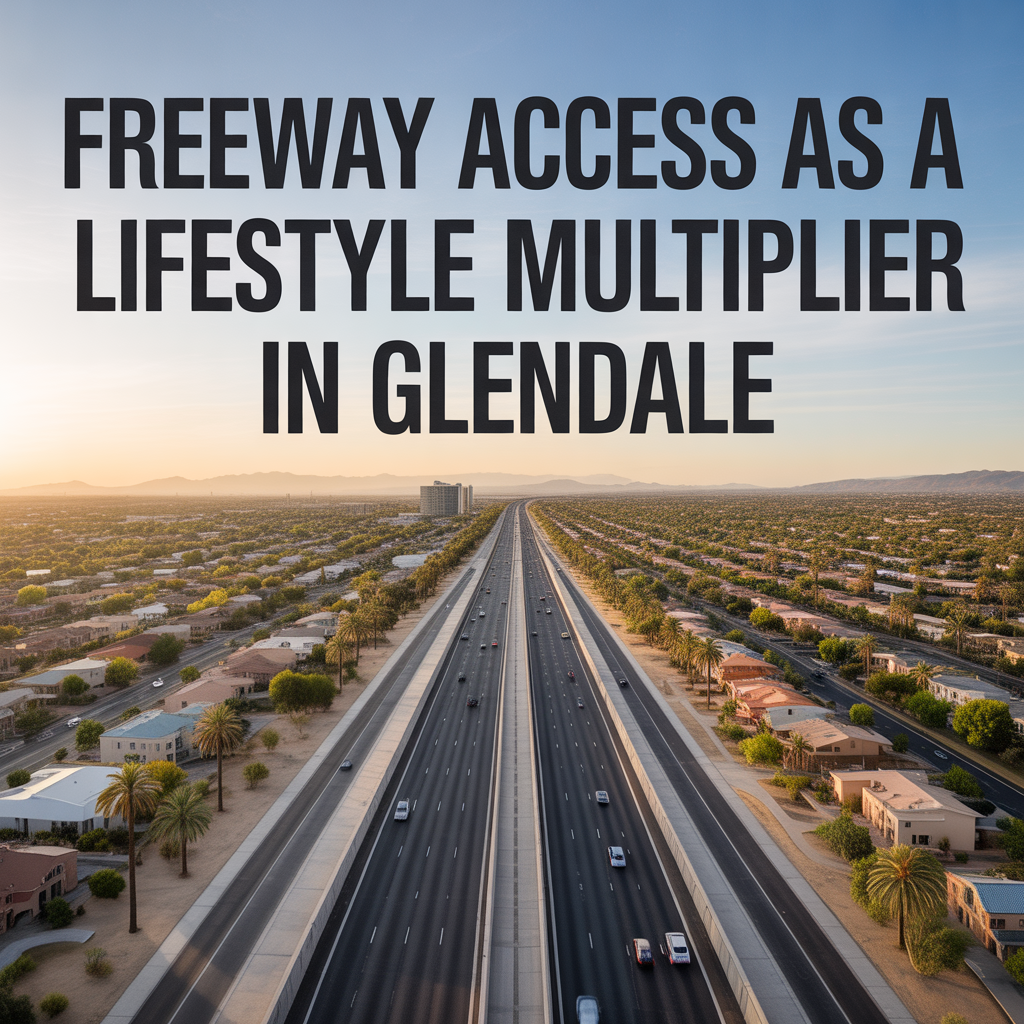
Freeway Access as a Lifestyle Multiplier in Glendale
-

Event-Night Traffic Impacts and Avoidance Strategies
-
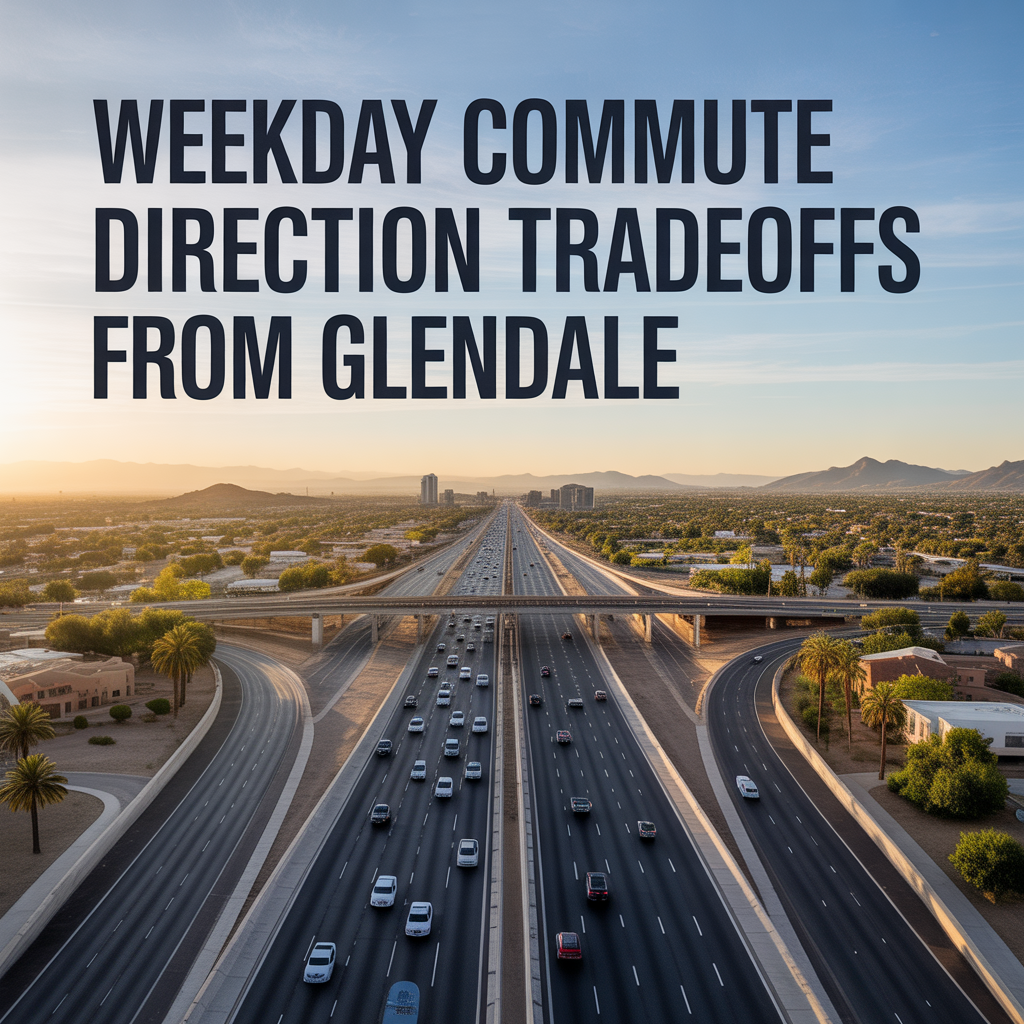
Weekday Commute Direction Tradeoffs From Glendale
-
Season Shifts in Outdoor Time in Glendale
-
Shade, Tree Cover, and Neighborhood Comfort
-

Dog and Kid Friendly Outdoor Routines
-

Trail Access That Feels Routine-Friendly
-
Sports Parks and Family Recreation Patterns
-
Map Proximity vs Summer Usability in Glendale
-
Daily-Use Parks vs Weekend Outdoor Trips
-

Top 10 “Date Night Out” Spots in Glendale