


This guide is part of our Current Real Estate Market Insights → [Current Real Estate Market Insights]
Written by: Renee Burke
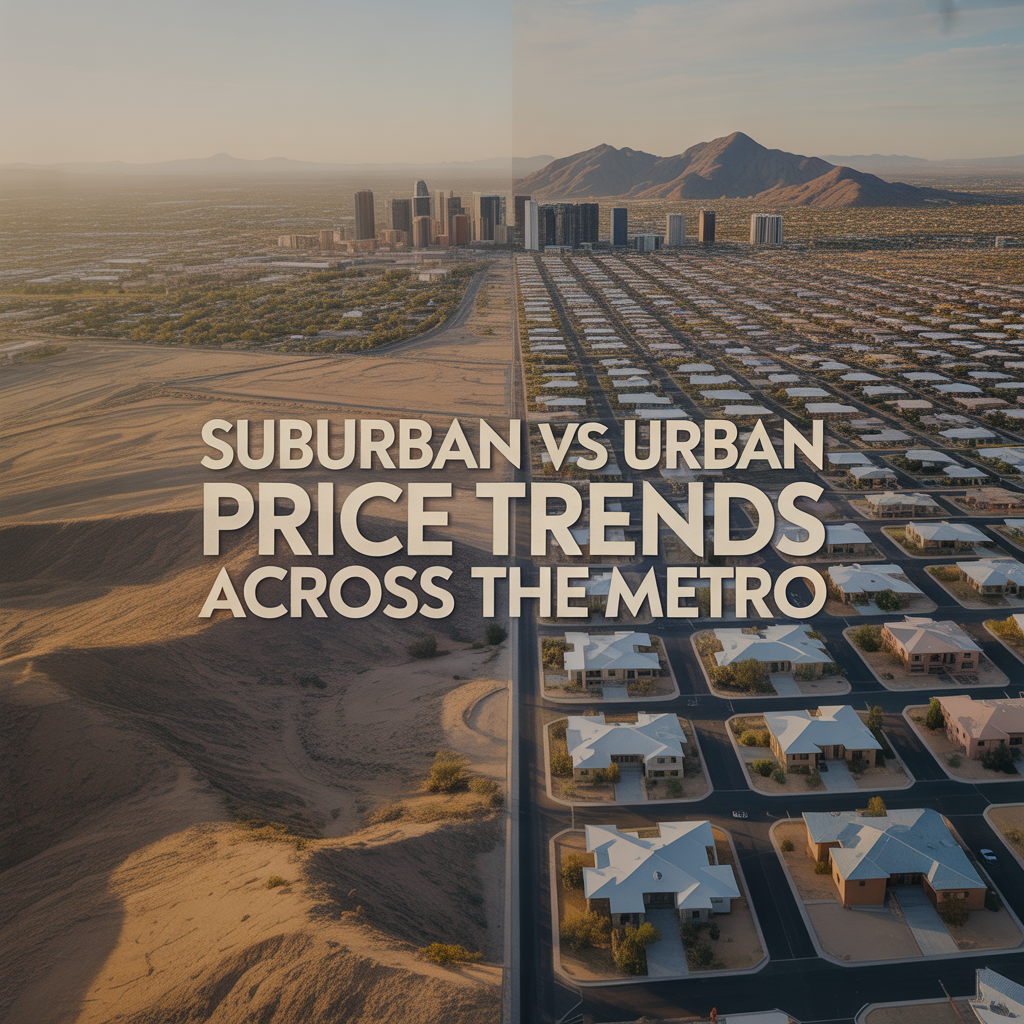
One of the first questions I hear from families eyeing a move in the Valley is whether to lean urban — close to the hum of downtown Phoenix — or suburban, with those spacious backyards in Chandler or Buckeye. Over the last few years, price trends have diverged noticeably, shaped by job hubs, school districts, and our endless appetite for desert patios and mountain views. Urban cores hold steady with premium appeal, while suburbs offer growth potential at more accessible entry points.
I’ve walked countless clients through these choices, from young professionals craving Biltmore walks to retirees plotting golf in Peoria. Today’s 2026 market shows urban medians around $450K-$550K — resilient but softening slightly — versus suburban ranges of $350K-$480K, where new builds and outer growth keep values climbing 4-6% annually in spots like Queen Creek. Let’s unpack the patterns, so you can see what fits your life.
Urban Core: Premium Stability
Phoenix proper and adjacent urban pockets — Arcadia, Tempe, parts of Glendale — command higher prices thanks to walkability, light rail access, and established charm. Median sold prices sit at $455K-$550K in early 2026, up just 1-2% year-over-year but 10-15% above suburban averages. These areas dipped 2-5% from 2022 peaks as rates rose, yet demand from Intel relocators and downtown workers keeps them firm.
Condos under $300K flood central listings — nearly 20% of inventory — but sales lag due to HOA fees and insurance hikes. Single-family urban homes average $670K list price, selling in 65-80 days. Families sometimes fear “overpaying for city noise,” but updated kitchens and pool proximity justify the premium here.
East Valley Suburbs: Family Premiums
Chandler, Gilbert, and Mesa blend suburban ease with urban-adjacent perks, posting medians of $480K-$620K — a 4% annual rise. Gilbert’s Agritopia gems hit $550K+, driven by Basis schools and Price Corridor jobs, outpacing urban by 10-20% in growth rate.
Mesa offers value at $450K-$550K, with Superstition Springs resales steady. These suburbs softened less in 2023 (3-4% dip) than urban, rebounding faster on family demand. Buyers get more square footage for the dollar — think 2,500 sq ft homes versus urban 1,800 sq ft equivalents.
West Valley Suburbs: Affordable Momentum
Glendale, Peoria, and Buckeye shine for entry-level buyers, with medians near $350K-$450K — 20-25% below urban cores. Five months’ inventory gives negotiation room, and prices rose 3-5% YoY despite metro dips. New builds near State Farm Stadium close quickest, fueled by first-timers.
Buckeye’s outer appeal — larger lots, TSMC proximity — pushes values up 6% yearly, closing the gap with urban. Concerns about “commute fatigue” are real, but Loop 303 expansions ease that.
South and Outer Suburbs: Boom Potential
Queen Creek, Maricopa, and San Tan Valley lead affordability at $320K-$417K medians, with 6-7% appreciation — fastest in the metro. New construction dominates (mid-3% builder rates lure buyers), and industrial parks like Lucid Motors propel demand.
Coolidge at $287K offers the deepest value, poised for surges from P&G plants. These areas lag urban in amenities but gain on space and future jobs, drawing investors wary of city premiums.
What’s Driving the Divide
Urban prices stabilize on lifestyle — cultural spots, shorter Sky Harbor runs — but face condo softness and higher costs. Suburbs thrive on jobs (TSMC, Mayo), schools, and space; outer rings accelerate with infrastructure like SR-24.
Rates at 6-6.2% favor suburban new builds with incentives, narrowing urban edges. Metro-wide, medians hover $445K-$450K, unchanged since 2023, but suburbs pull ahead in appreciation.
Misconception: “Suburbs always cheaper long-term.” Urban equity builds faster in hot resale markets; suburbs win on cash flow.
Advice for Buyers and Sellers
Urban Buyers/Sellers: Price for vibrancy — stage patios, highlight rail. Expect less flex but quicker flips.
Suburban Buyers/Sellers: Negotiate in West/outer (3-4% off list); East holds firm. Emphasize yards, schools.
Overall, suburbs gained more ground post-2023, but urban retains prestige.
Your Valley Fit
Whether urban buzz or suburban stars, Phoenix trends reward matching life to location. I’ve seen families thrive in both — it’s about your rhythm.
If you’re thinking about making a move in Phoenix, you don’t have to figure it out alone.
Let’s map your suburb or urban options over coffee. I’m here.
Get the full Phoenix Market Insights → [Market Insights]


-

How the Phoenix Desert Climate Shapes Everyday Life Inside the Home
-

How Phoenix Weather Patterns Shape Everyday Home Routines
-
Why Homes Often Feel More Comfortable After the First Year of Ownership
-

How Living in Phoenix Changes the Way Homeowners Use Their Homes
-

What New Phoenix Homeowners Learn During Their First Year of Ownership
-

How Daily Life Changes After the First Year of Living in a Phoenix Home
-
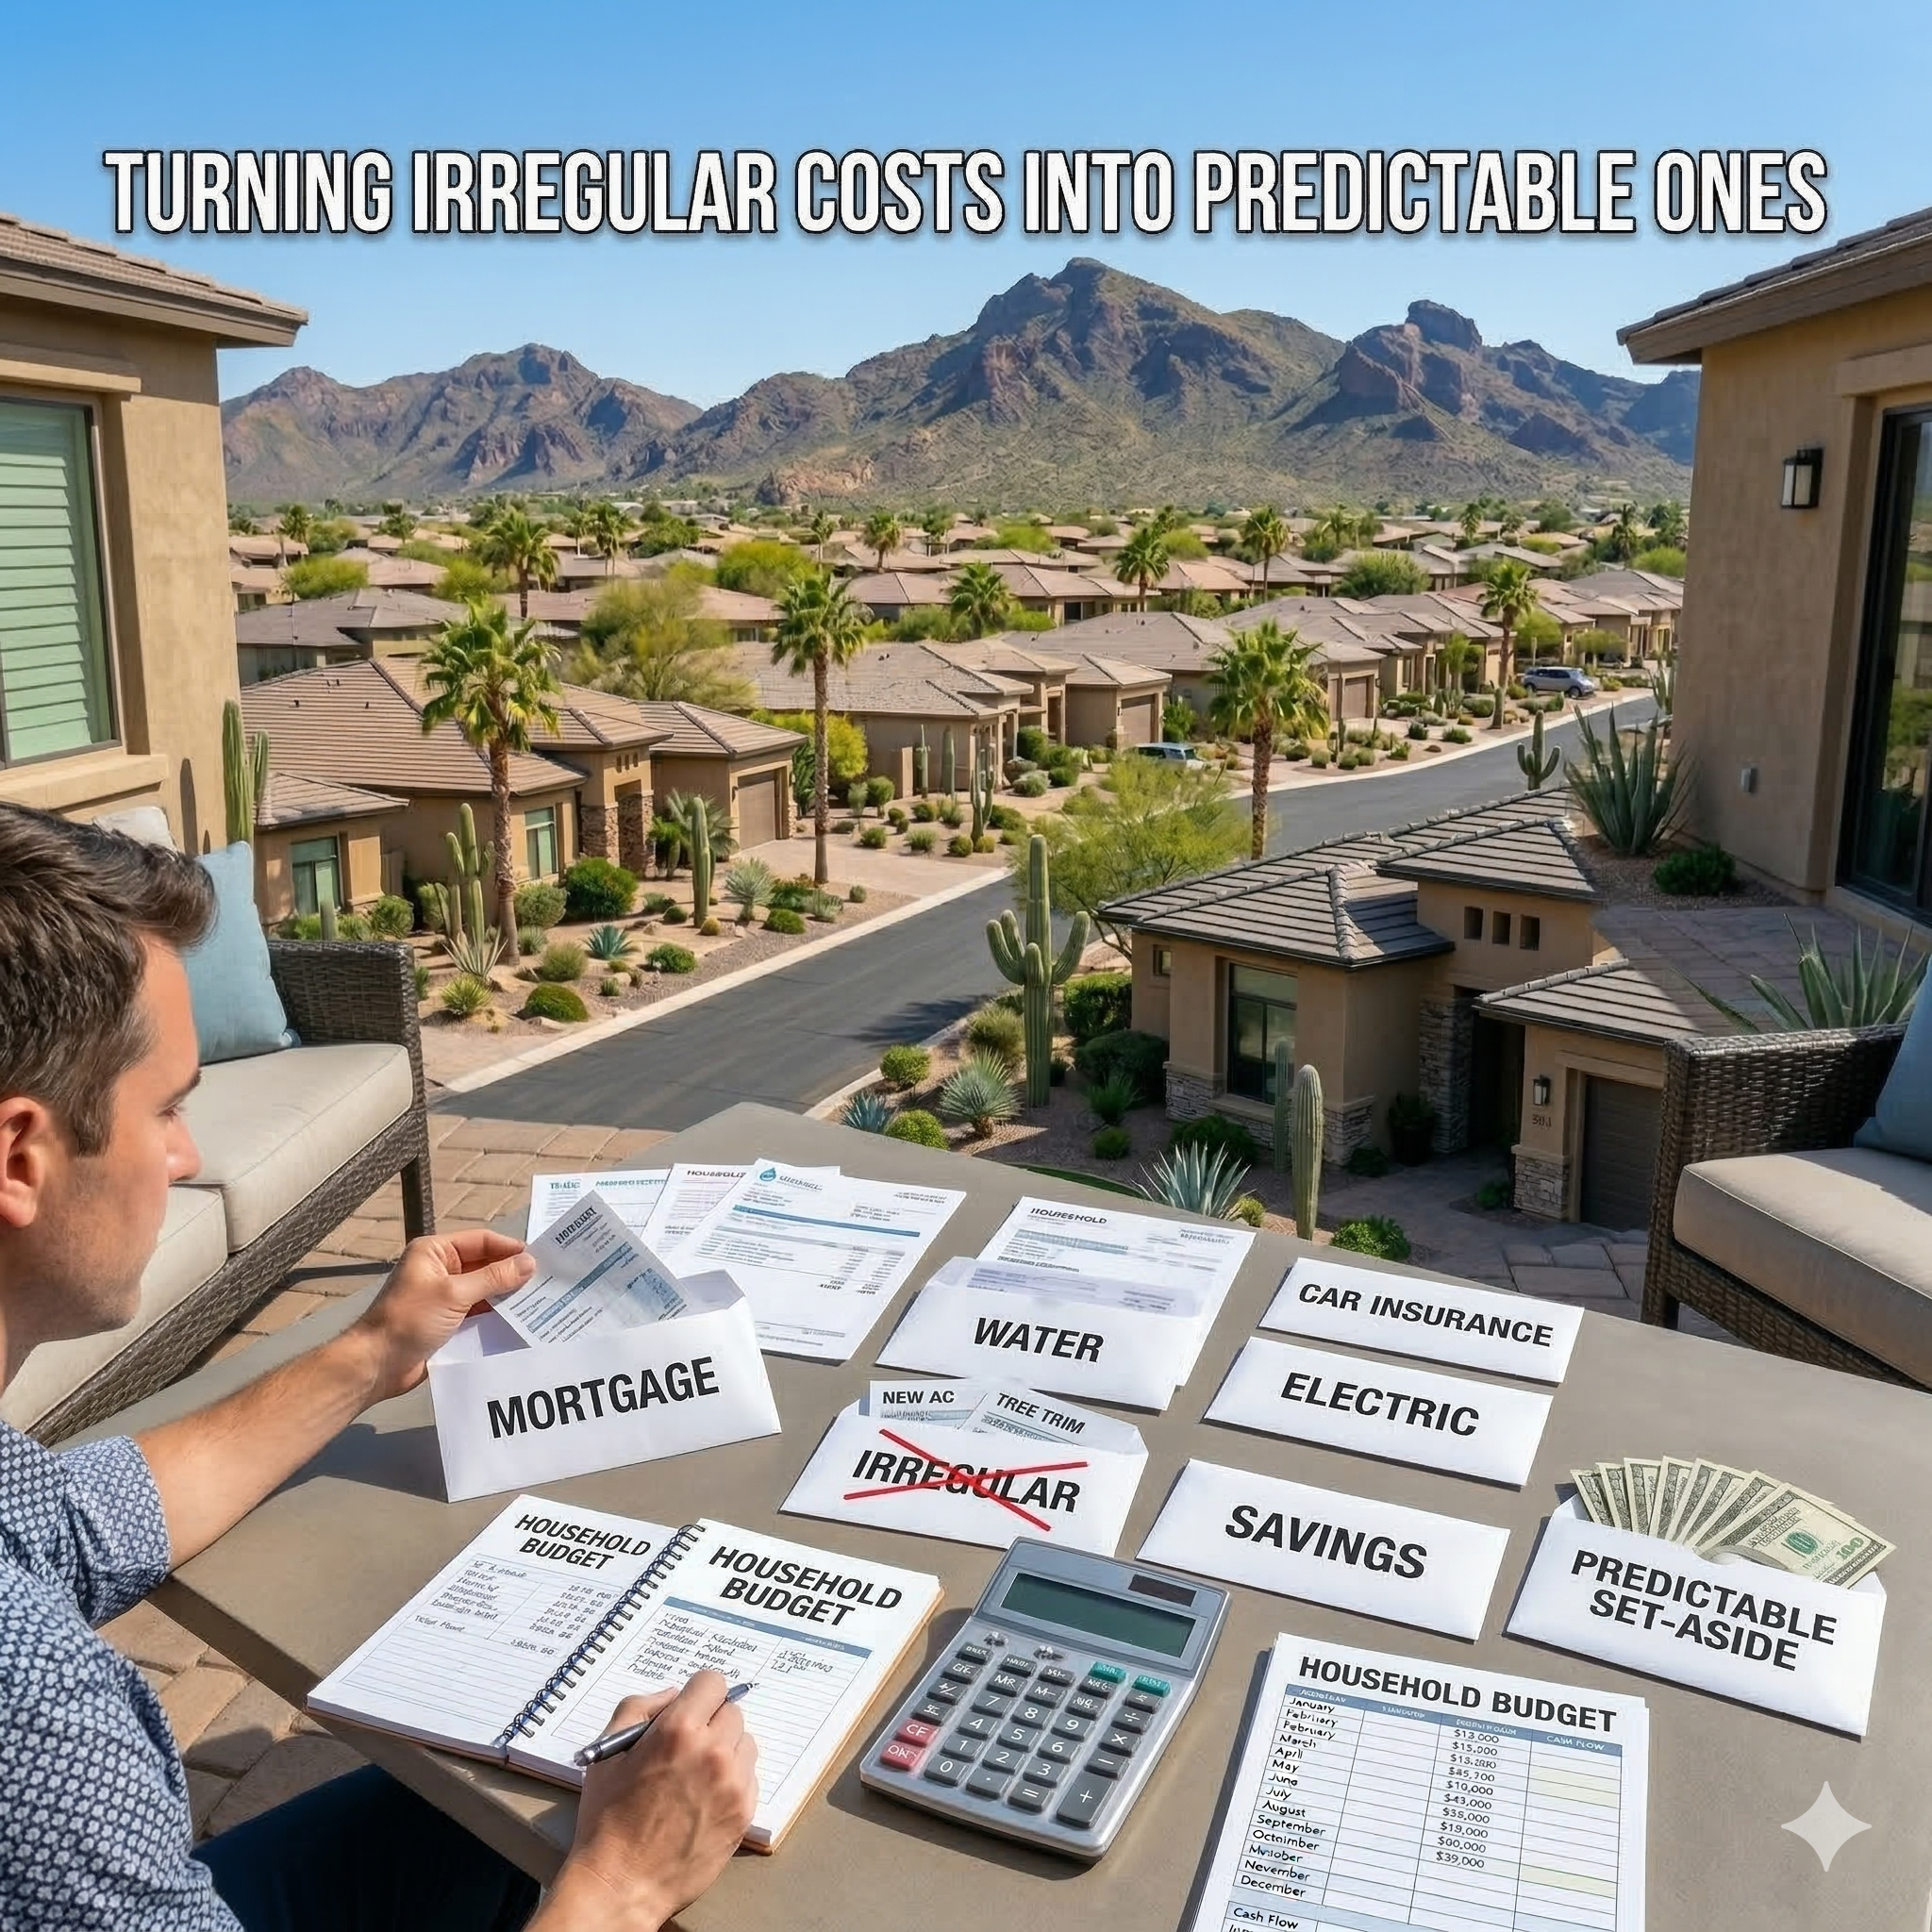
Turning Irregular Costs Into Predictable Ones
-

Budgeting for Ongoing Ownership
-

Repair vs Replace vs Defer Decisions
-

Planning Homeownership Like a Long-Term Asset
-

What Home Expenses You Can Safely Delay
-

Stopping Cost Creep Early
-

Cash Flow vs Net Worth Stress
-

Why “It’s Not That Much” Adds Up
-

Warning Signs Your Ownership Budget Is Tightening
-

The Cumulative Cost of Small Home Repairs
-

Designing Budgets Around Local Conditions
-
Utility Costs Over Time in Desert Climates
-

Insurance Increases Explained for Arizona Homeowners
-
How Inflation Impacts Phoenix Homeownership Costs
-

Avoiding Debt-Driven Homeownership Decisions
-

Replacing Systems on Your Timeline
-

Why Emergency Repairs Cost More
-

Timing Major Expenses Without Financial Shock
-
How Much to Keep in a Phoenix Home Reserve Fund