



This guide is part of our Current Real Estate Market Insights → [Current Real Estate Market Insights]
Written by: Renee Burke
Living through Phoenix real estate cycles feels a bit like our desert seasons — predictable in their rhythm, yet each one shaped by unique winds. Over decades, our Valley market has swung from frenzied booms to necessary pauses, always rebounding stronger because of jobs, sunshine, and that pull of wide-open spaces. These cycles aren’t random; they reflect how families, retirees, and investors respond to rates, inventory, and life here.
I’ve guided clients through every phase — the post-recession climb, pandemic rush, recent cooling — and what stands out is preparation. Understanding the patterns helps you breathe easier, whether buying in Gilbert or selling near South Mountain. Let’s walk through the classic stages, with Phoenix-specific insights, so you see where we sit today and what whispers next.
Expansion: Demand Outpaces Supply
This is the exciting upswing, when buyer energy surges. Homes fly off MLS shelves in 30-45 days; prices climb 10-20% yearly. Think 2020-2022: remote workers fled California for Queen Creek lots, Intel expansions filled Chandler, and medians jumped from $350K to $480K+. Multiple offers became routine, especially for updated ranches with pebble tec pools.
Locals know the signs — spring training buzz swells open houses in Mesa, snowbirds turn visits into bids on Sun City gems. Inventory dips under 3 months; sale-to-list ratios top 100%. Families worry about “missing out,” but smart positioning — pre-approval, must-haves like trails or schools — secures wins.
Phoenix thrives here on migration: 50K+ newcomers yearly chase no state tax and 300 sunny days.
Peak: The Frothy Top
At cycle peaks, exuberance peaks too. Every home feels hot; even fixers in Buckeye draw crowds. Prices stretch — Scottsdale hit $900K+ medians in 2022 — but cracks show: bidding wars hit 20+ offers, days on market shrink to 20-30, and builders rush entitlements.
Caution whispers: overbuilding risks loom, as in late 2005 when construction spiked before the fall. Yet our job base (TSMC fabs, Mayo Clinic) cushions better than past peaks. Sellers celebrate equity; buyers stretch budgets, sometimes overlooking inspections.
Contraction: The Cooling Breath
Then comes the pullback. Rates rise (like 2022’s 7%+ jump), demand eases, inventory climbs to 4-6 months. Prices soften 5-10% — 2023 saw $485K medians dip to $460K — and days on market stretch to 60-80. Nearly 60% of sales fall under list, giving negotiation room.
Phoenix’s version feels milder: West Valley new builds absorb moves, East Valley schools hold families steady. Misconception: “Crash incoming.” No — healthy corrections clear froth, as post-2008 when values dropped 50% but rebuilt on fundamentals.
Buyers gain power; sellers price realistically, emphasizing desert curb appeal.
Trough: Opportunity Emerges
The bottom feels quiet — inventory peaks at 9+ months, prices stabilize low (2009’s $150K medians). Buyers hesitate from headlines, but patient ones snag Chandler foreclosures or Glendale steals. Sales tick up as first-timers enter.
Here’s the gift: equity rebuilds fast on the next upswing. Phoenix troughs pass quicker — 18 months post-2008 vs. national years — thanks to job resilience and land limits.
| Cycle Phase | Inventory (Months) | Price Trend | Days on Market | Phoenix Hallmark |
|---|---|---|---|---|
| Expansion | <3 | +10-20% | 30-45 | Migration boom |
| Peak | 2-3 | +5-10% | 20-30 | Bidding frenzy |
| Contraction | 4-6 | -5-10% | 60-80 | Negotiation wins |
| Trough | 9+ | Flat/low | 100+ | Bargain entries |
Phoenix’s Unique Rhythm
Our cycles sync with lifestyle: winter peaks draw snowbirds to Fountain Hills; summer troughs favor locals trading up quietly. History echoes — 1920s boom, 1980s S&L dip, 2005 bubble (18 months’ supply), 2020 surge. Each rebounds on economy: semiconductors now, like manufacturing then.
2026 feels balanced — 4.4 months’ supply, 62-72 DOM, medians $445K-$450K flat or -2%. Not trough, but post-peak exhale heading to expansion as rates ease.
Drivers: TSMC jobs, Loop 303 growth, water security through 2050. We magnify booms with migration but soften busts via diversity.
Spotting Your Cycle Moment
Buyers: Contraction/troughs shine — more choices in Peoria, incentives in new builds. Sellers: Expansion/peaks maximize equity; stage patios, time winter.
Fear not volatility; it’s our market breathing. Long-term? 4-6% annual growth, cycle-averaged.
If you’re thinking about making a move in Phoenix, you don’t have to figure it out alone.
I’ve navigated every turn with families like yours. Let’s map your timeline — questions welcome over coffee, or margaritas!
Get the full Phoenix Market Insights → [Market Insights]


-
Cost of Living in Rhode Island: Housing, Taxes, Utilities, and Everyday Expenses
-

What If My Commute Becomes Worse Than Expected?
-

How Aging Home Systems Affect Property Value
-

Energy Efficiency Upgrades for Phoenix Homes
-
How to Plan for Major Home System Replacements
-

When Phoenix Homeowners Should Replace Water Heaters
-

Repair vs Replace Decisions for Phoenix HVAC Systems
-

Creating a Long-Term Home Maintenance Plan
-

How Often Phoenix Homes Should Be Professionally Inspected
-

Early Warning Signs of Major Home System Failures
-

How Preventative Maintenance Protects Phoenix Property Value
-

The Best Annual Home Maintenance Plan for Phoenix Homes
-

Electrical Safety Inspections for Older Phoenix Homes
-

Why Whole-Home Surge Protection Matters in Arizona
-

Preparing a Phoenix Home for Electric Vehicle Charging
-

Signs Your Home’s Electrical System Is Overloaded
-
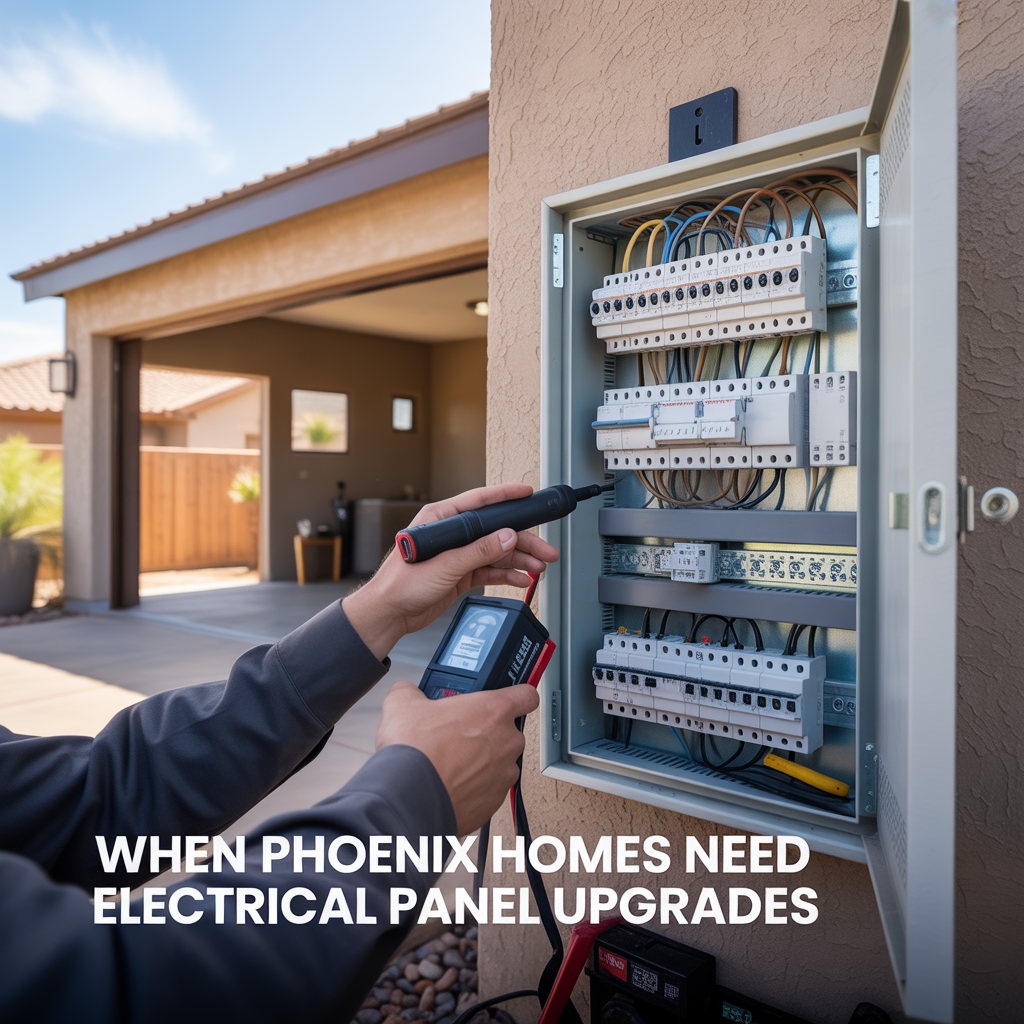
When Phoenix Homes Need Electrical Panel Upgrades
-

Water Pressure Problems in Phoenix Homes Explained
-

Preventing Irrigation Leaks That Waste Water in Desert Landscapes
-

Signs of Hidden Plumbing Leaks in Phoenix Houses
-

How Long Water Heaters Last in Arizona Homes
-

How Hard Water Affects Plumbing Systems in Phoenix Homes
-

Preventing Water Damage in Phoenix Homes During Storms
-

Roof Maintenance Tips Before Phoenix Monsoon Season
-
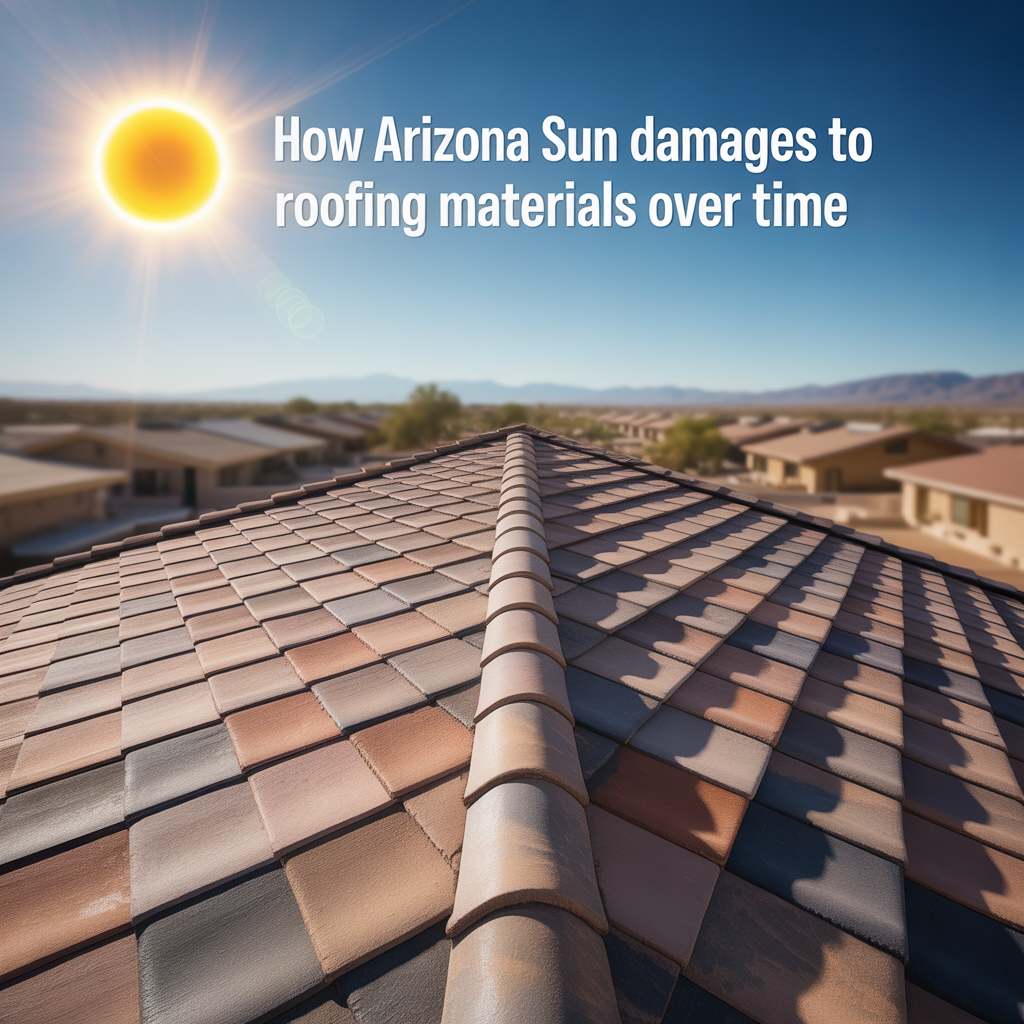
How Arizona Sun Damages Roofing Materials Over Time