


Chandler Lifestyle Guide → [Chandler Lifestyle Guide] & For more info on Chandler Real Estate → [Chandler Real Estate Guide]
Written by: Renee Burke
I’ve walked through quite a few Chandler rentals over the years that started out promising — nice townhome near Price Road, fresh paint, a tidy lease signed with enthusiasm — only to see owners scratch their heads a few years later, wondering why the cash flow isn’t what they expected. It’s not always about market downturns or bad tenants; often, it’s the subtle mismatches between property type, location, and tenant expectations in this steady East Valley city that cause rentals to underperform over time. As someone who’s advised investors through the ups and downs here, I can tell you Chandler’s rental scene rewards thoughtful choices — strong jobs at Intel and families in Chandler Unified keep demand humming — but certain pitfalls quietly erode returns if you’re not paying close attention.
Let’s explore why some properties lag long-term, blending the practical numbers with the day-to-day realities I’ve seen play out in neighborhoods from Ocotillo to Andersen Springs. If you’re eyeing rentals here, spotting these early can save you from that nagging “what if.”
Location Mismatch: Too Far from the Action
Rentals in Chandler’s outer edges — say, south of Ray Road or east near the Queen Creek line — often underperform because they promise affordability but deliver isolation. Tenants, especially young professionals commuting to Microchip or NXP, crave five-minute drives to the Price Corridor, not 20–25 through stoplights. Families prioritize Chandler Unified’s top schools like Basha High, so properties feeding lesser-rated boundaries see higher turnover.
A three-bedroom in Sun Groves might rent fast at $2,400 initially, but long-term? Vacancies stretch past 30 days as renters opt for core spots near Loop 202. Maintenance calls rise too — longer drives mean deferred fixes, souring reviews on Zillow or Apartments.com. Investors regret it when appreciation lags too; peripheral rentals grow value at 3–4% yearly versus 5–6% in Fulton Ranch fringes. It’s the daily grind that drains: tenants bolt for convenience, leaving you chasing new leases.
Wrong Property Type for Tenant Turnover
Chandler’s renter pool skews transient — tech workers relocating, families upsizing after two years — so properties built for “forever” tenants flop. Large single-family homes with big yards sound great for families, but pools guzzle chemicals ($150/month service), yards dust up in monsoons, and cleaning between tenants costs $1,000+. Smaller townhomes or condos in HOAs like Cooper Commons perform better: lock-and-leave appeal for busy pros, shared pools cut your liability.
Duplexes or older block homes from the 80s? They attract price-sensitive renters who stretch budgets, leading to evictions when rents tick up 2–3% yearly. Long-term underperformance shows in cap rates dipping below 4%, as turnover eats 20–30% of annual gross. I’ve seen four-bedrooms sit empty summers while two-beds near Downtown Chandler re-rent in days. Match the home to the market, or watch NOI erode.
Maintenance and Age Creep Up Silently
Desert life accelerates wear, and neglected upkeep turns solid rentals into money pits. Flat roofs leak after five monsoons, AC units strain by year three ($4,000 replacements), stucco cracks spiderweb from heat cycles. First-year owners budget lightly, then face $10K surprises, slashing returns.
Older inventory — prevalent in east Chandler — draws complaints: outdated kitchens lose premium renters to shiny Gilbert apartments. Pools without covers algae up, pest issues (scorpions eastside) recur without quarterly sprays. Long-term, unaddressed fixes tank occupancy; good tenants ghost for turnkey spots. Investors regret skipping warranties or reserves — 1% of property value yearly keeps them humming, ignoring it compounds to 10% losses over five years.
Rent Pricing Chasing the Market Wrong
Chandler rents hover $2,300–$2,400 median for three-beds, up modestly 2–3% yearly, but overpricing kills momentum. Greedy hikes to $2,700 in a softening market (post-rate peaks) lead to 45–60 day vacancies, costing $4,000+ in lost revenue. Underpricing? Locks subpar tenants who never upgrade.
Seasonality bites too: summer vacancies spike as snowbirds leave and heat chases families. Short-term rentals near Tumbleweed Park thrive March–April (Ostrich Festival), but year-round Airbnbs average 50% occupancy, underperforming long-term leases at 95%. Data shows stable pricing wins — chase peaks, and your five-year IRR drops from 8% to 5%.
Tenant Quality and Eviction Ripples
East Valley eviction rates tick up as wages lag rents, hitting Chandler too. Rentals attracting entry-wage service workers overperform short-term but falter long-term — late pays, damages exceeding deposits. Tech pros pay reliably but demand polish; mismatch them with dated units, and turnover soars.
Screening saves: credit 650+, income 3x rent. Skip it for quick fills, and repairs eat profits. Long-term, poor tenant history scares quality applicants, perpetuating cycles. Evictions scar listings online, extending voids.
HOA and Regulatory Headwinds
Amenity-rich HOAs like Fulton Ranch ($400/quarter) lure tenants but cap flexibility — no Airbnbs, paint approvals slow re-leasing. Rules against fences or sheds frustrate families, prompting moves. Non-HOA older homes? Freedom, but buyers regret yard wars with neighbors.
City codes tighten: energy audits, pool barriers add $2K compliance. Long-term, restrictive covenants stifle updates, holding rents below market.
Market Saturation in Wrong Niches
Chandler’s rental growth cools — inventory up, rents flat — hitting oversupplied segments. Townhomes flood $1,800–$2,000 range; luxury single-families near Ocotillo hold premiums. Betting big homes post-pandemic? Many underperform as families buy in.
Airbnbs shine seasonally but lag long-term leases amid regs. Focus single-family cores near jobs/schools for 6–8% yields.
Signs of Underperformance to Watch
- Vacancies over 30 days twice yearly.
- Rent concessions exceeding 10% of list.
- Maintenance over 10% of gross rents.
- Turnover costing one month’s rent annually.
Choosing Winners for the Long Haul
Opt core locations, 2–3 beds, newer builds. Budget reserves, screen rigorously. Chandler rewards stability — top rentals yield 7–9% steadily.
A Thoughtful Next Step
Rentals thrive with insider eyes on pitfalls. I’ve optimized portfolios here, turning laggards into stars.
If you’re thinking about making a move in Phoenix, you don’t have to figure it out alone.
Let’s review your targets — I’m here with the full picture.
Get the full Phoenix Market Insights → [Market Insights]


-

How the Phoenix Desert Climate Shapes Everyday Life Inside the Home
-

How Phoenix Weather Patterns Shape Everyday Home Routines
-
Why Homes Often Feel More Comfortable After the First Year of Ownership
-
How Living in Phoenix Changes the Way Homeowners Use Their Homes
-
What New Phoenix Homeowners Learn During Their First Year of Ownership
-

How Daily Life Changes After the First Year of Living in a Phoenix Home
-
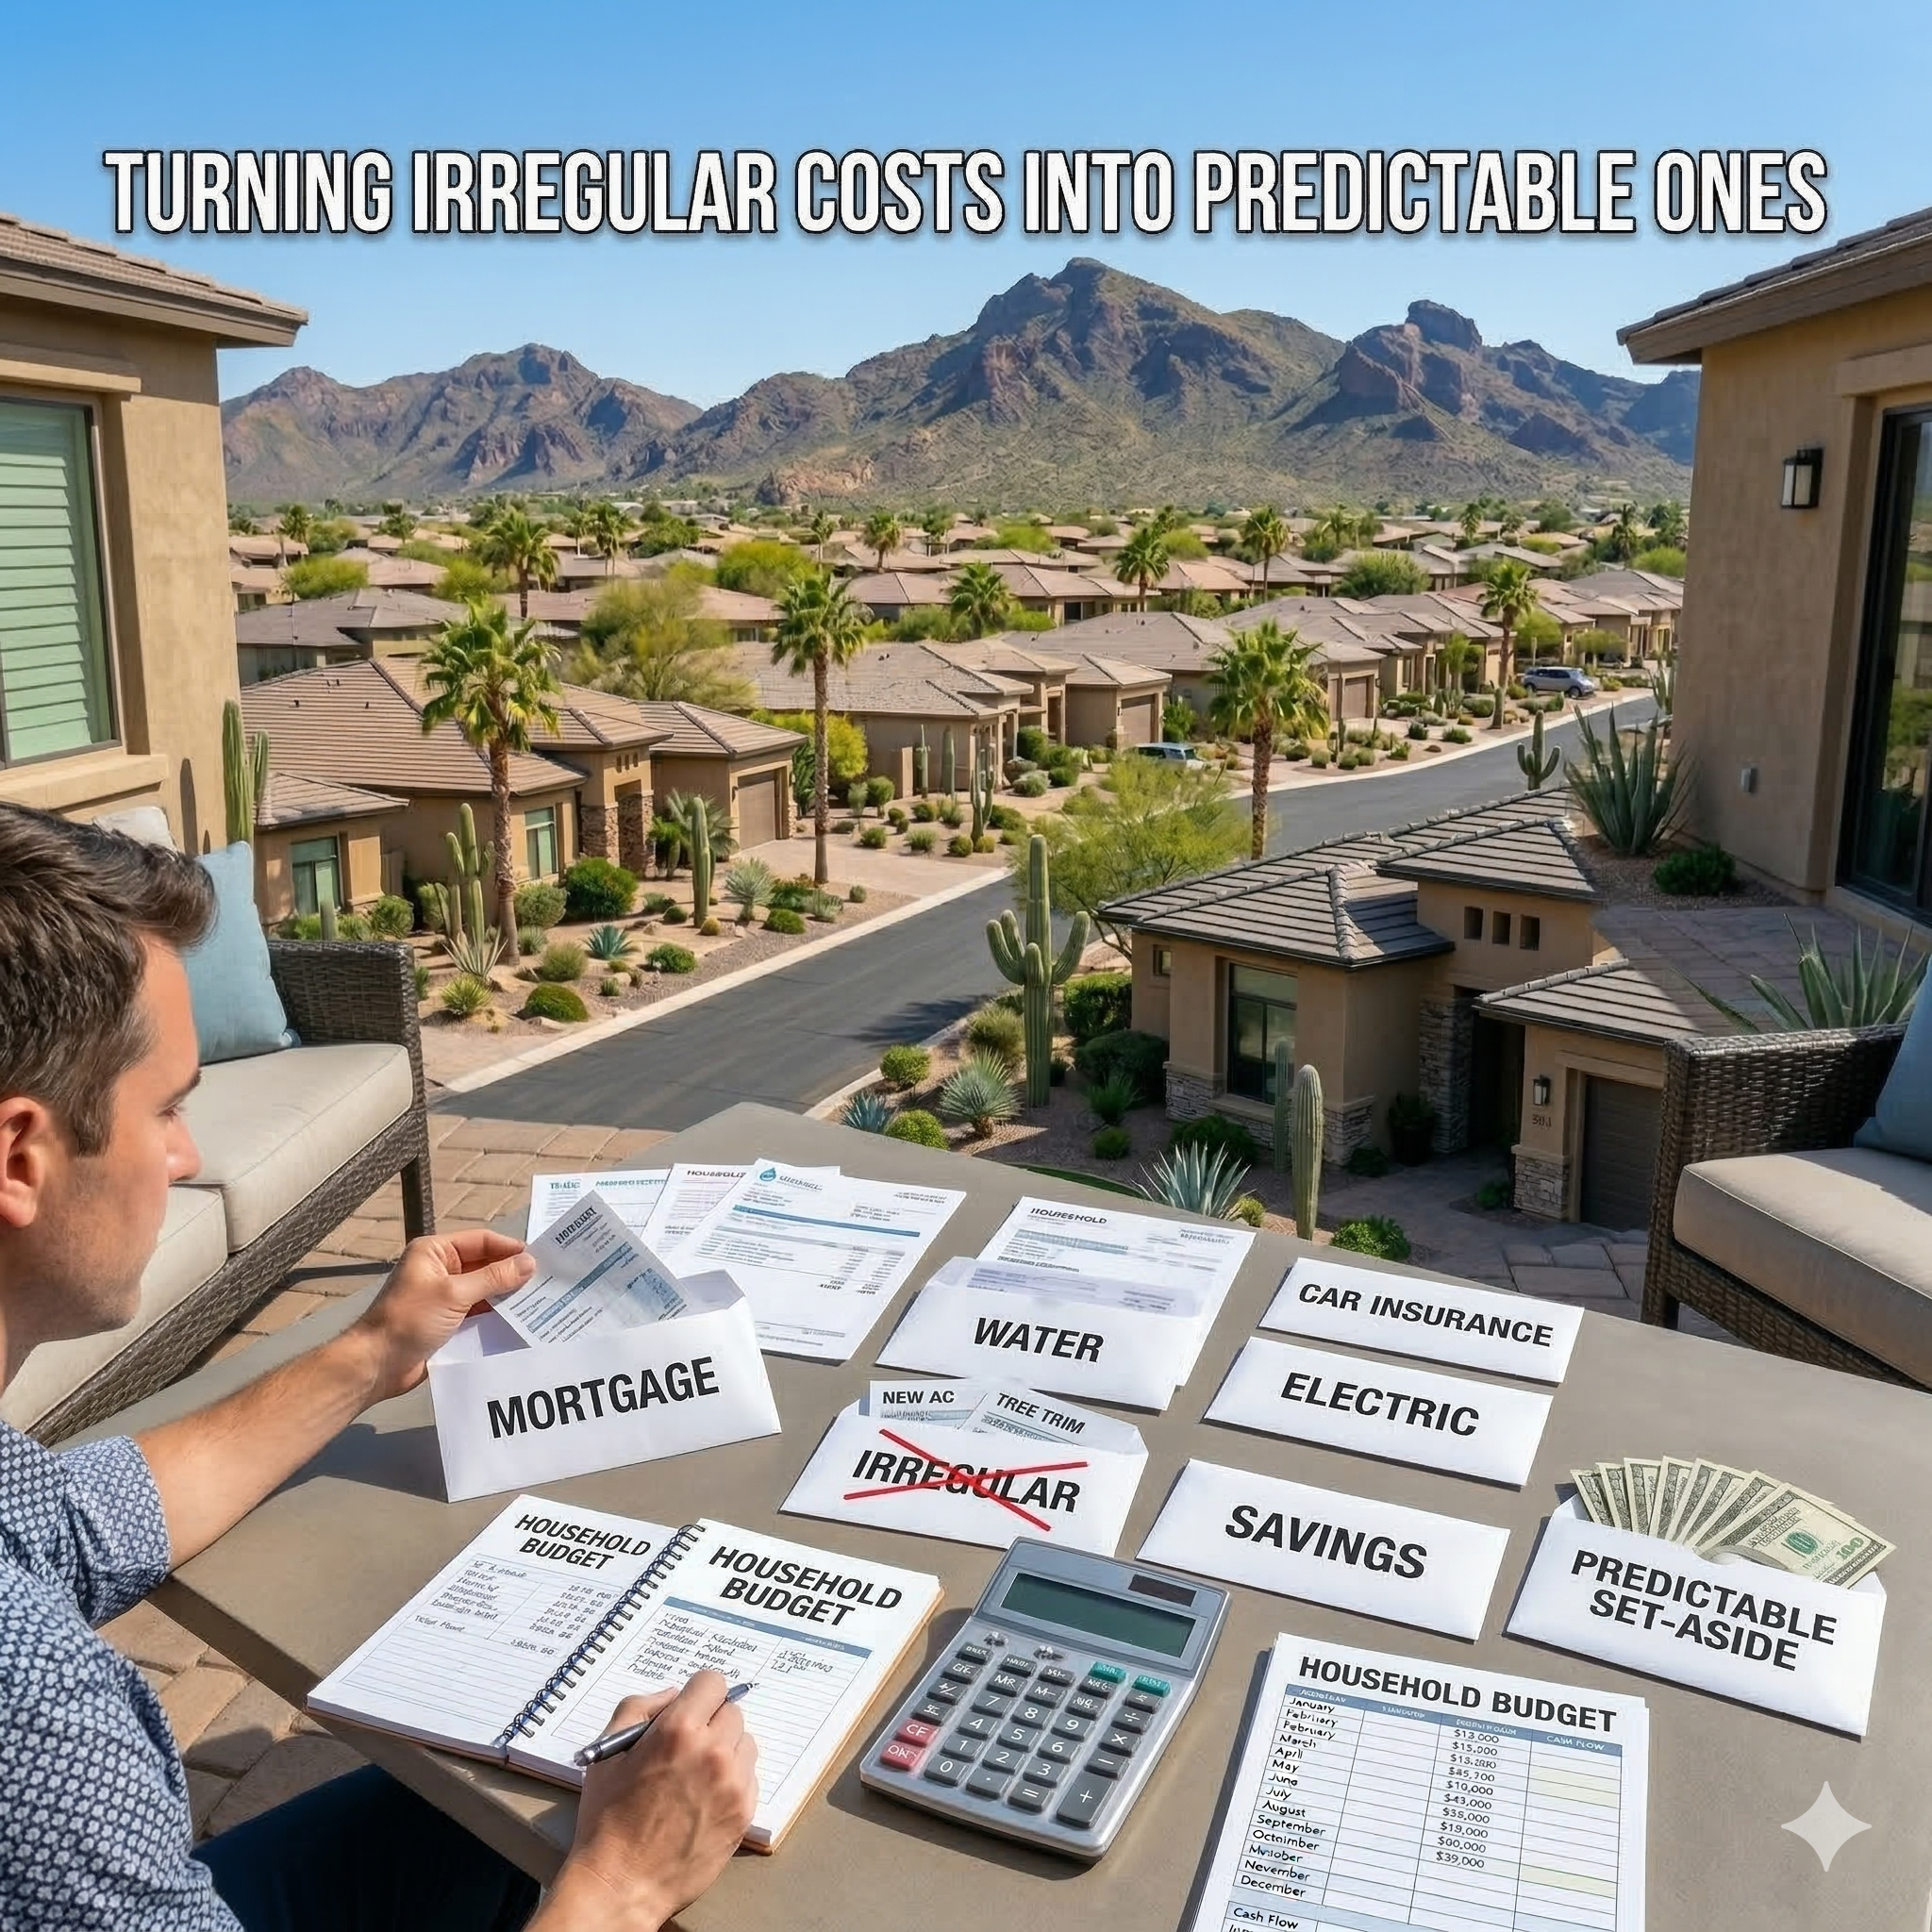
Turning Irregular Costs Into Predictable Ones
-

Budgeting for Ongoing Ownership
-
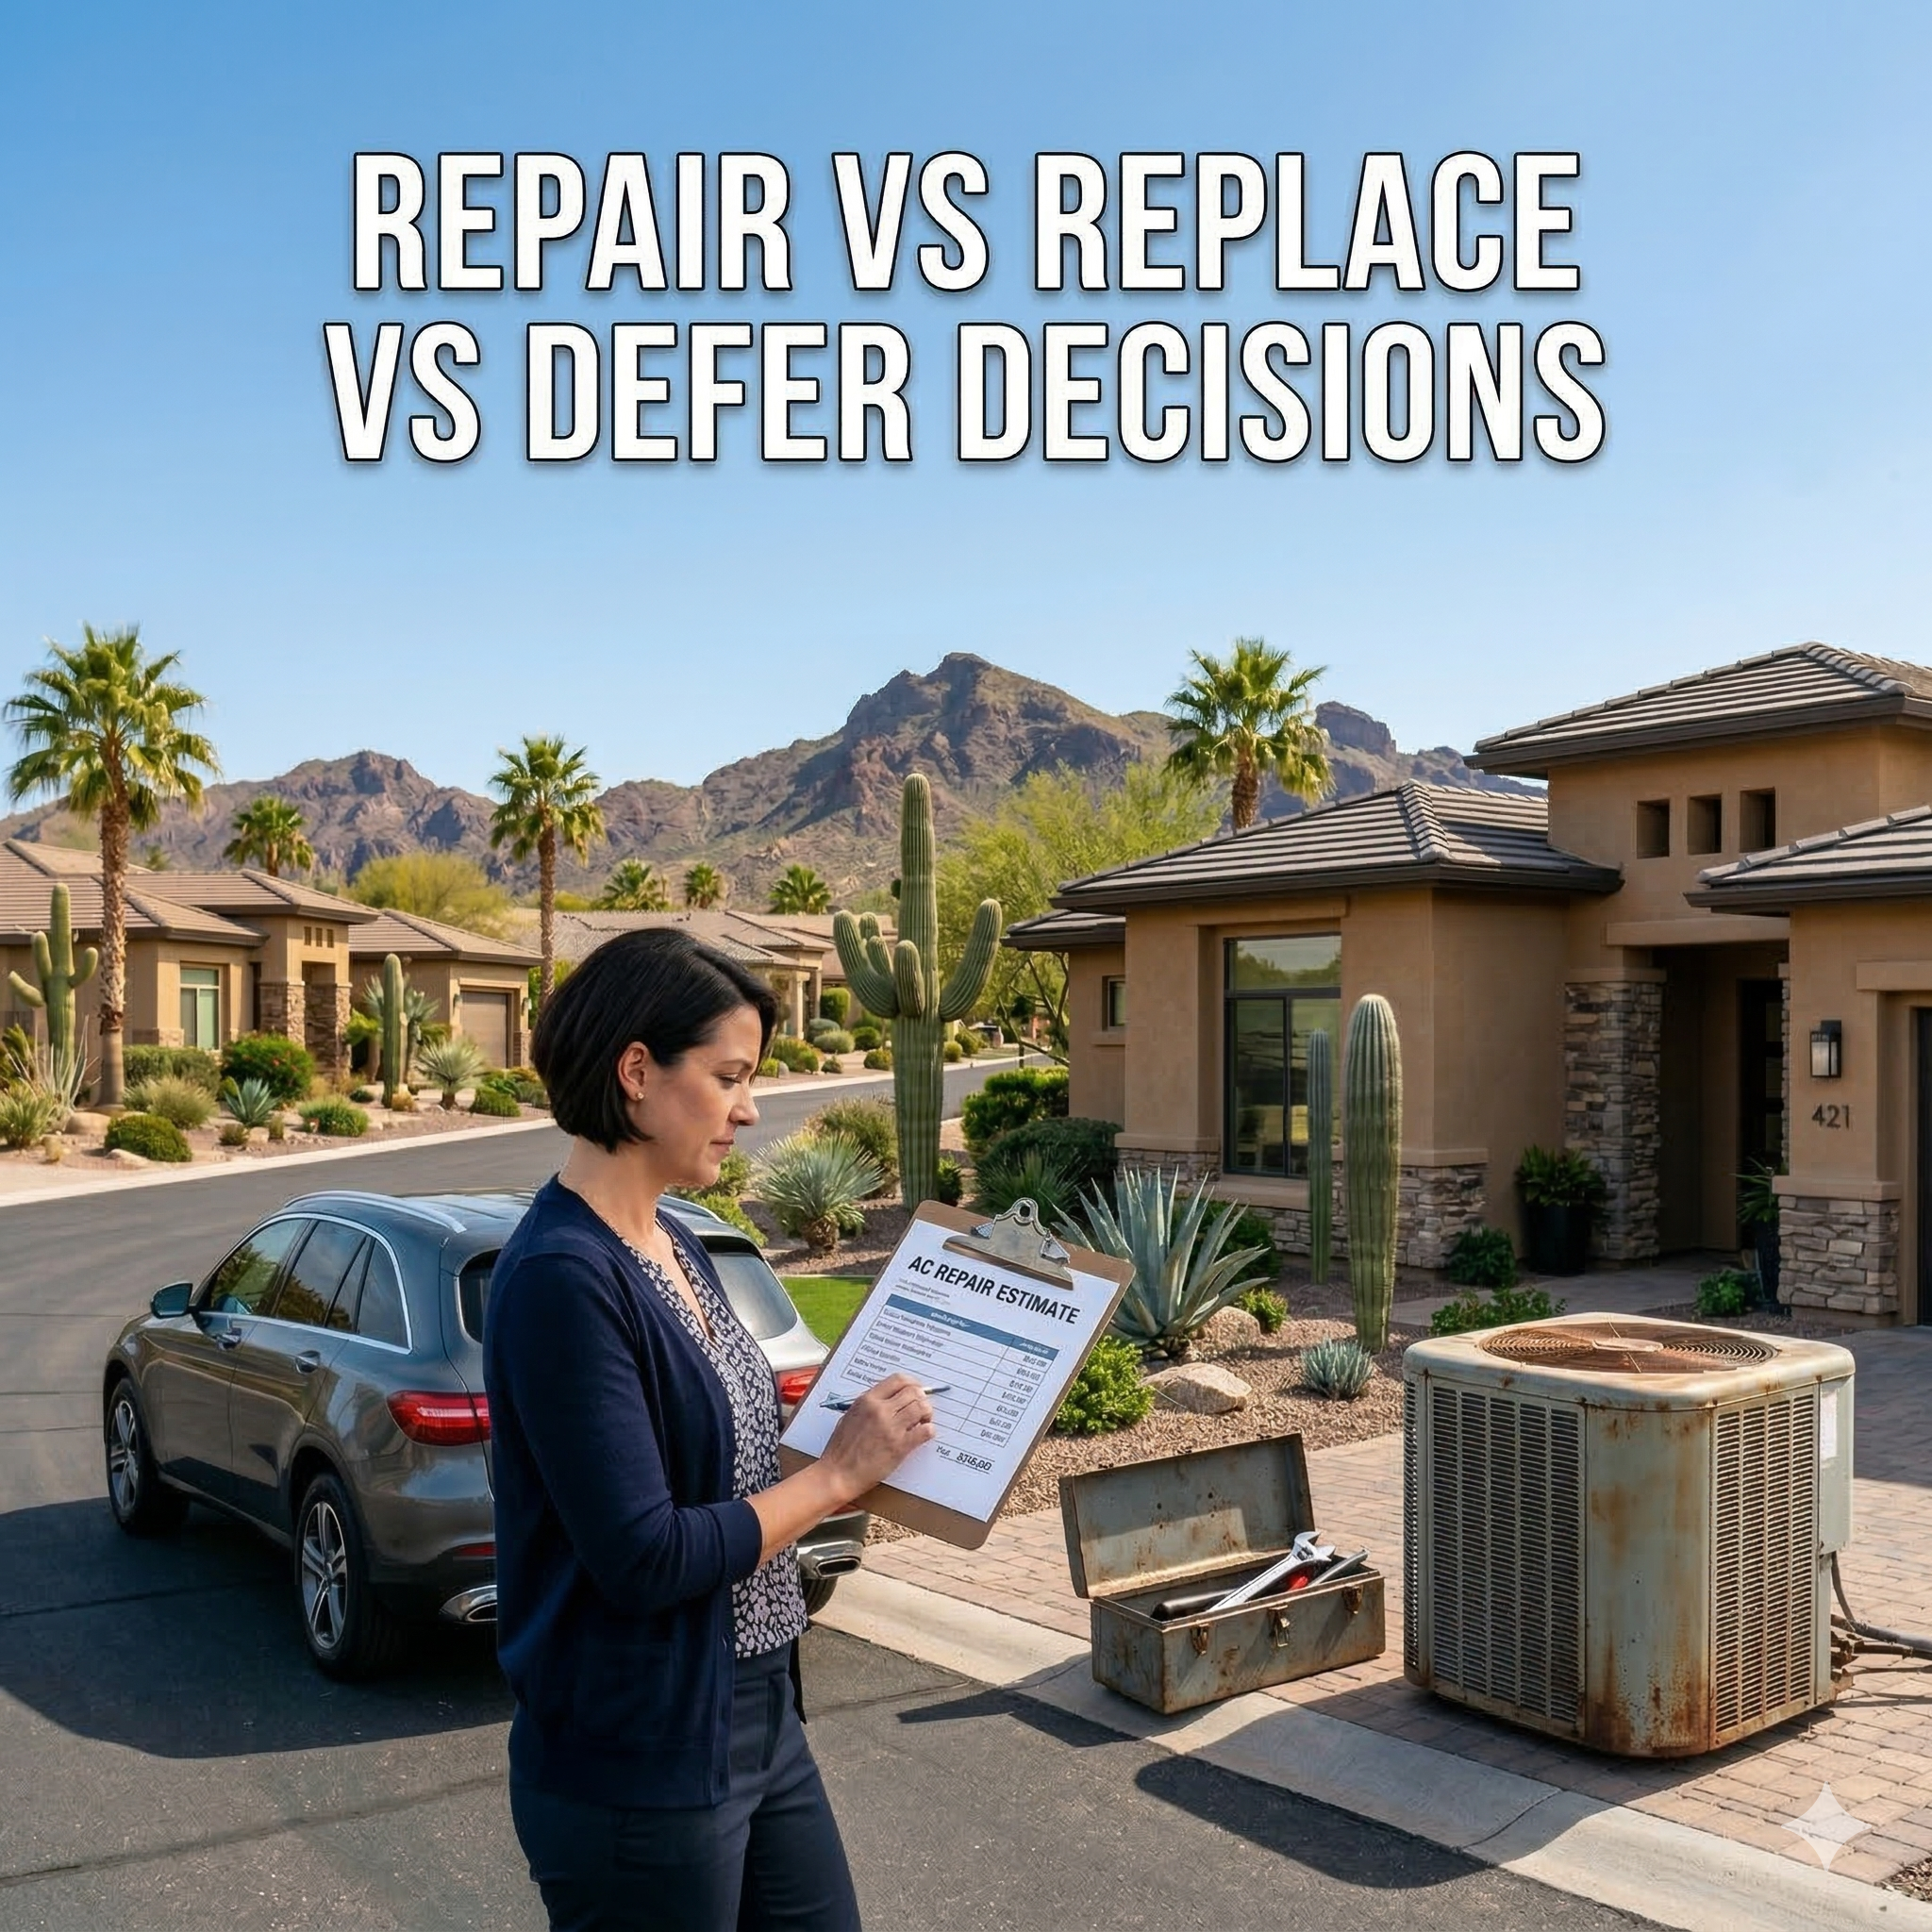
Repair vs Replace vs Defer Decisions
-

Planning Homeownership Like a Long-Term Asset
-

What Home Expenses You Can Safely Delay
-
Stopping Cost Creep Early
-

Cash Flow vs Net Worth Stress
-

Why “It’s Not That Much” Adds Up
-

Warning Signs Your Ownership Budget Is Tightening
-

The Cumulative Cost of Small Home Repairs
-

Designing Budgets Around Local Conditions
-
Utility Costs Over Time in Desert Climates
-

Insurance Increases Explained for Arizona Homeowners
-
How Inflation Impacts Phoenix Homeownership Costs
-

Avoiding Debt-Driven Homeownership Decisions
-

Replacing Systems on Your Timeline
-

Why Emergency Repairs Cost More
-

Timing Major Expenses Without Financial Shock
-
How Much to Keep in a Phoenix Home Reserve Fund