


Phoenix Lifestyle Guide → [Phoenix Lifestyle Guide] & For more info on Phoenix Real Estate → [Phoenix Real Estate Guide]
Written by: Renee Burke
Days on market—those quiet numbers ticking up on listings—tell a story far richer than headlines about hot or cold markets. In the Phoenix metro, where we’ve ridden frenzy to freeze and now a thoughtful thaw, DOM offers a window into buyer confidence, seller pricing, and the real pulse of demand. It’s not just how long homes sit; it’s what that time reveals about families weighing their next chapter here in the Valley.
If you’ve wondered why some Arrowhead ranches linger while Vistancia new builds snap up fast, let’s unpack DOM’s deeper signals. Early 2026 data across Phoenix shows an average of 65-70 days—up from pandemic-era sprints but steady, signaling a market where buyers choose with care.
From Frenzy to Measured Pace
A few years back, Phoenix DOM averaged 10-15 days—bidding wars on anything under $600,000, sight unseen offers stacking up. That was peak demand outstripping supply, fueled by low rates and migration waves.
Now, metro-wide, homes average 69 days on market as of February 2026. It’s longer, yes, but not stalled—pending sales hold firm, and well-priced properties close in 40-50 days. This shift reflects buyers returning, just selectively: touring multiple options, negotiating inspections, prioritizing lifestyle fits like proximity to Loop 101 or Peoria’s P83 district.
It’s healthier demand, not weaker. Families aren’t frozen; they’re focused.
What DOM Reveals by Price Point
DOM varies sharply by segment, spotlighting where buyer appetite thrives:
- Under $500,000: 75-85 days. Entry-level in Glendale or Mesa lingers as affordability bites—mid-6% rates push payments high. Yet demand ticks up here; first-timers snag FHA deals with concessions.
- $500K-$800K: 55-65 days. Move-up sweet spot in Peoria’s Westwing or Gilbert’s San Tan—steady traffic from equity-rich sellers trading up.
- $800K+: 45-60 days in Scottsdale’s DC Ranch, quicker for luxury. Cash buyers and stock-wealthy relos ignore rates, drawn to views and gated peace.
Condos stretch longest at 80+ days, competing with single-family space. New construction? Often 30-45 days, thanks to builder incentives. These patterns show demand alive, just discerning—favoring value and Valley perks.
Neighborhood Signals Across the Metro
Zoom into pockets, and DOM paints demand’s map:
East Valley like Gilbert clocks 60 days—families chase Agritopia schools, but overpriced flips sit. West Valley’s Surprise hits 70, balancing Vistancia trails with Buckeye’s outer growth. Central Phoenix Arcadia? Crisp 50 days for mid-century charmers near Papago.
North Scottsdale luxury dips under 50—view homes move on whispers. South Tempe or Laveen stretch 75-80, where urban revival meets measured interest. Shorter DOM correlates with schools, freeways, and lifestyle anchors like Arrowhead’s buzz—proof demand chases quality of life here.
Why DOM Isn’t Just About Demand
Longer days don’t spell weak buyers; they flag other forces:
- Pricing realism. Homes 5% over comps add 20-30 DOM—buyers scroll Zillow, know their zip.
- Seasonal breath. January listings peak, easing into spring surge.
- Lock-in thaw. Life events—jobs at TSMC, empty nests—override rate fears, lifting supply without crashing demand.
Stable mid-6% rates help too: buyers trust today’s numbers won’t vanish tomorrow. Pending ratios near 50% show serious shoppers, just not sprinters.
Demand’s True Health Check
Look beyond raw DOM to absorption rates—homes sold per active listings. Phoenix hovers 20-25%, healthy, not flooded. Closed sales up year-over-year whisper resilience; new pendings rise as inventory stabilizes at 4-5 months.
Builders ease off aggressive builds, resale regains ground—DOM holds as demand absorbs selectively. It’s not 2021 mania, but sustainable pull from semiconductor jobs, healthcare hubs, and our endless sun.
Seller Takeaways from the Numbers
If you’re listing, DOM guides strategy:
- Price to hyper-local comps—your street’s last three sales.
- Stage for lifestyle—pool pops in Glendale, views shine in Foothills.
- Expect 45-60 days if sharp; use time for targeted opens near stadium events or trails.
Buyers gain too: leverage for repairs, no rush regrets.
Busting DOM Myths
“Is longer DOM a crash?” No—demand’s selective, not gone. “Buyer’s market everywhere?” Balanced, with seller edges in premium spots. “Will it drop fast?” Stability trumps swings; watch spring for momentum.
Phoenix demand endures—rooted in our growth, not speculation.
A Clearer Demand Picture
Days on market in 2026 reveal a Phoenix buyer empowered, not absent—choosing homes that fit lives amid trails, stadiums, and sunsets. It’s steady demand, rewarding the prepared.
From Glendale’s energy to Scottsdale serenity, the Valley hums with intention.
Let’s Decode It Together
If you’re thinking about making a move in Phoenix—or curious what DOM means for your neighborhood—you don’t have to figure it out alone.
I’ve tracked these rhythms across the Valley for years, helping families read between the numbers to find their fit. Whether a quick call or deep dive into your options, I’m here as your trusted guide.
Reach out anytime. Valley decisions deserve clarity, confidence, and a local hand—let’s shape yours.
Get the full Phoenix Market Insights → [Market Insights]

-

How the Phoenix Desert Climate Shapes Everyday Life Inside the Home
-

How Phoenix Weather Patterns Shape Everyday Home Routines
-
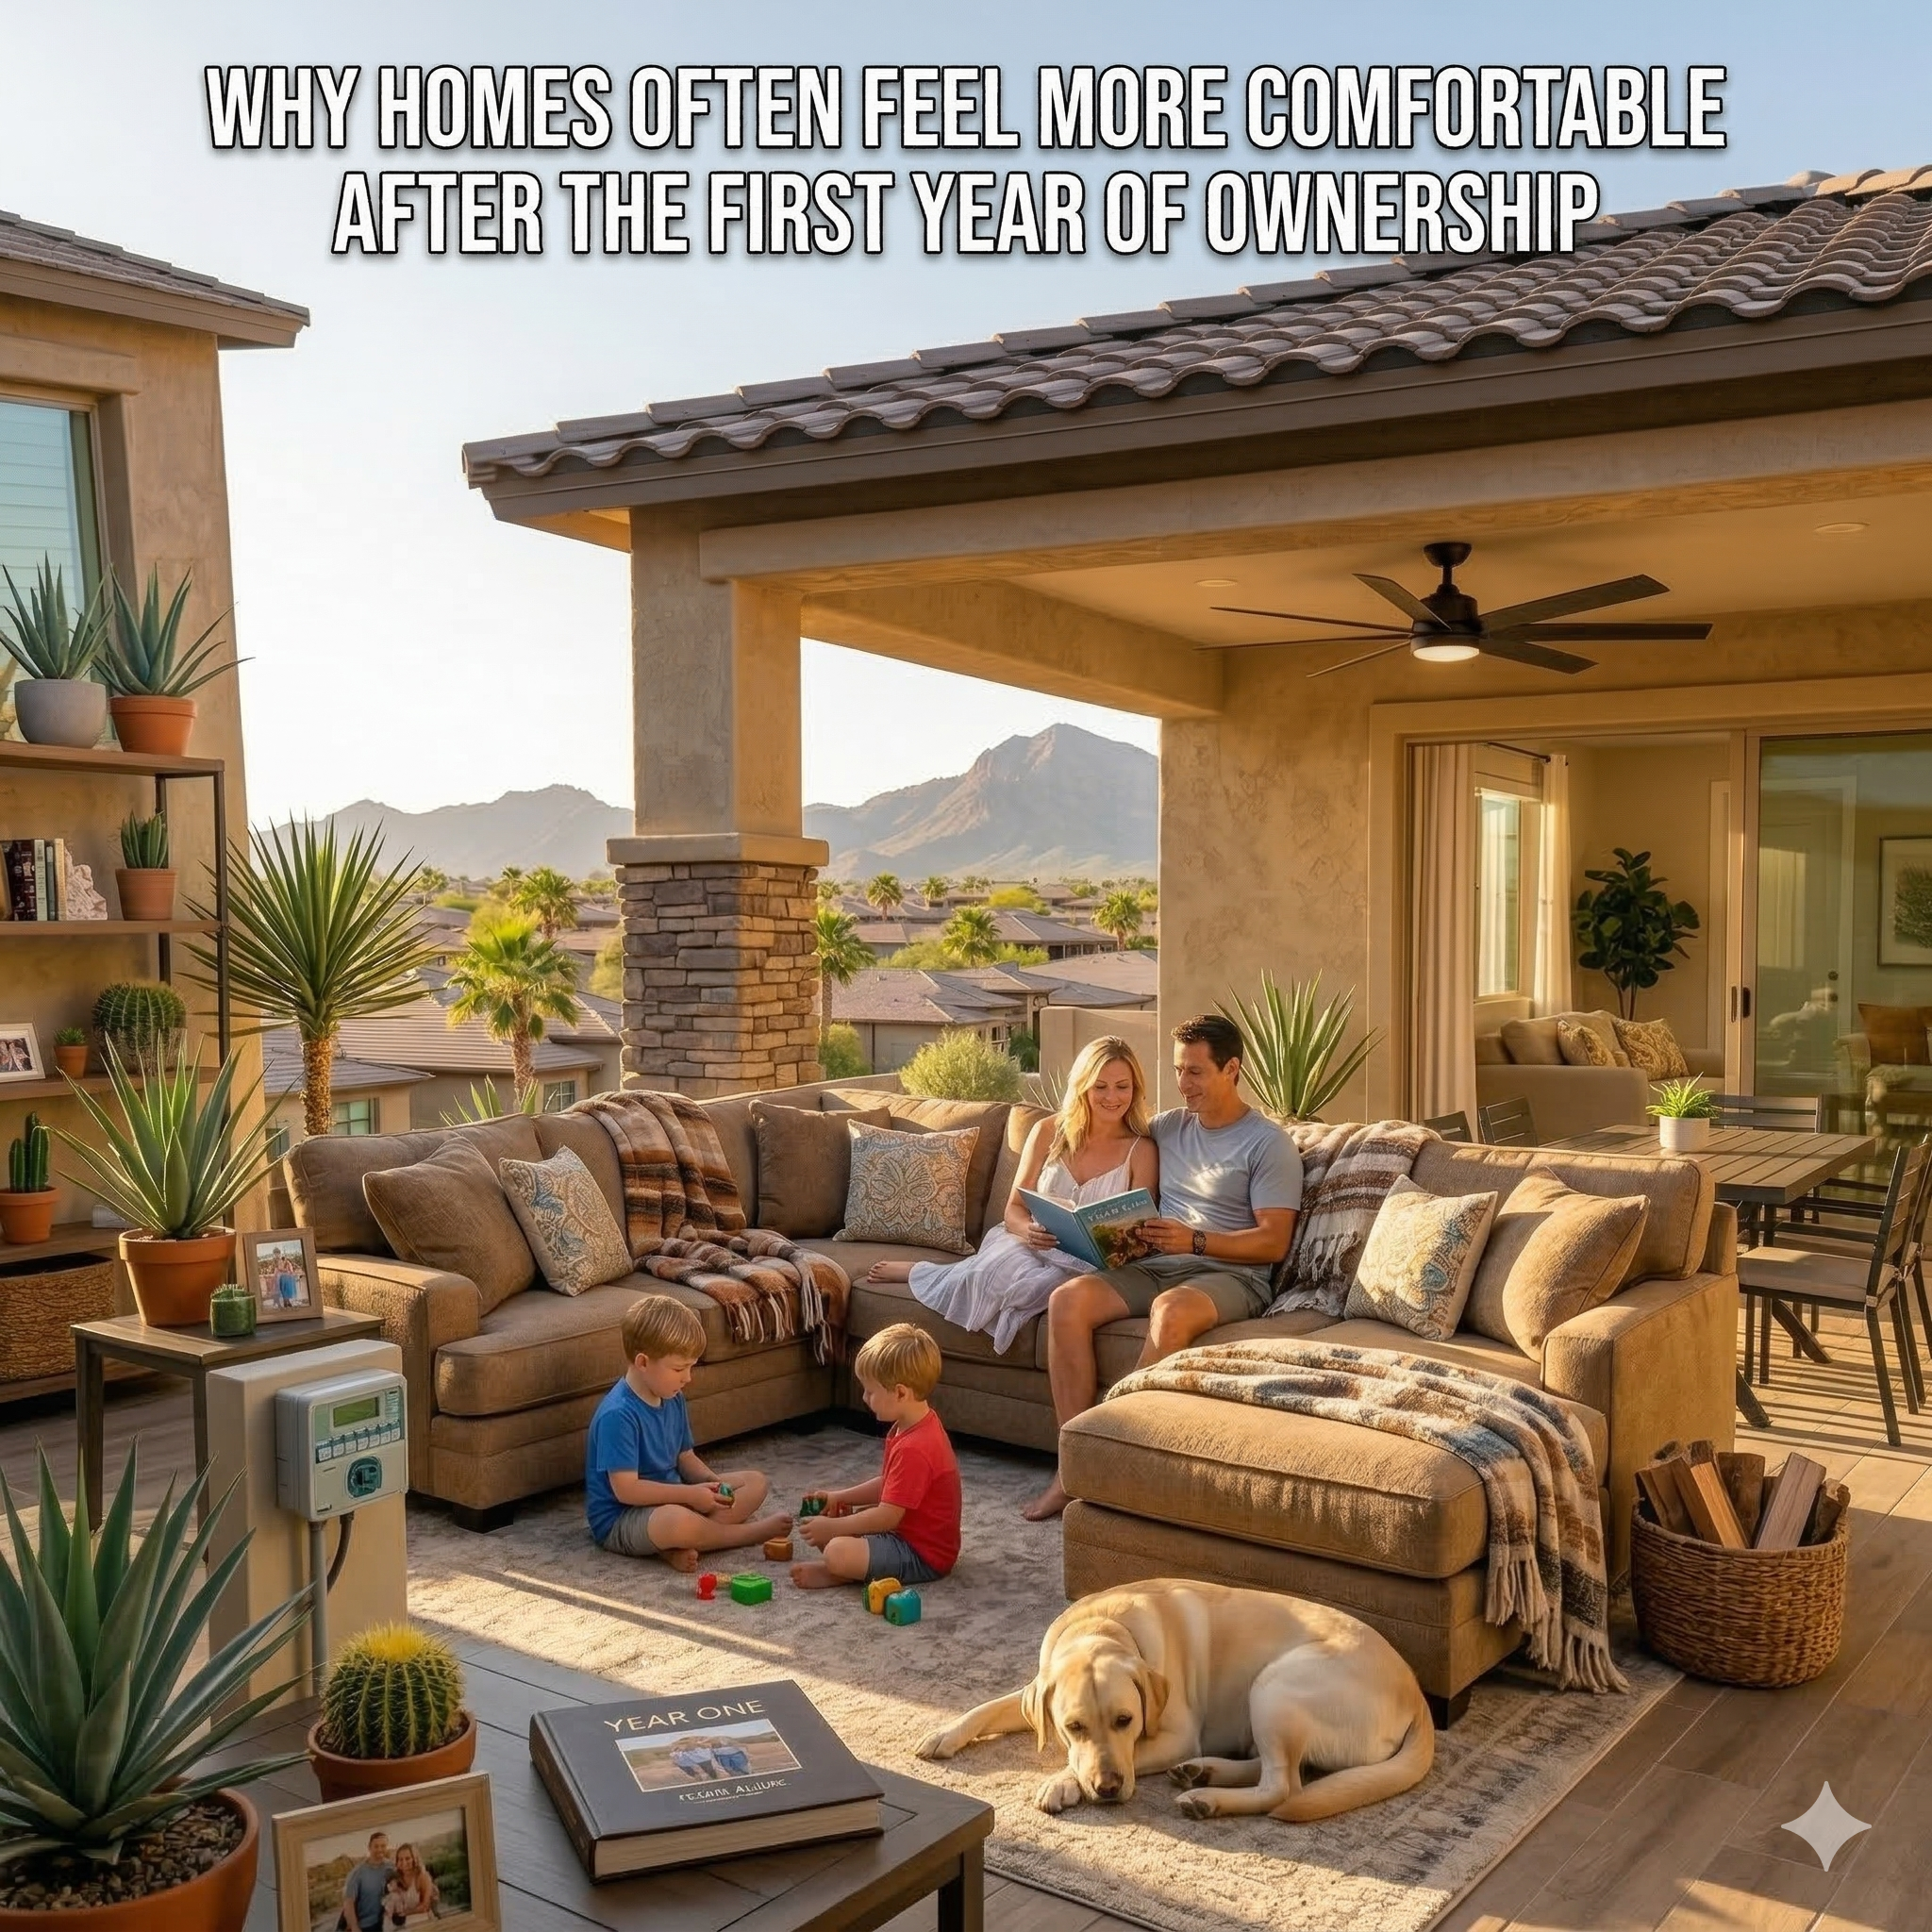
Why Homes Often Feel More Comfortable After the First Year of Ownership
-
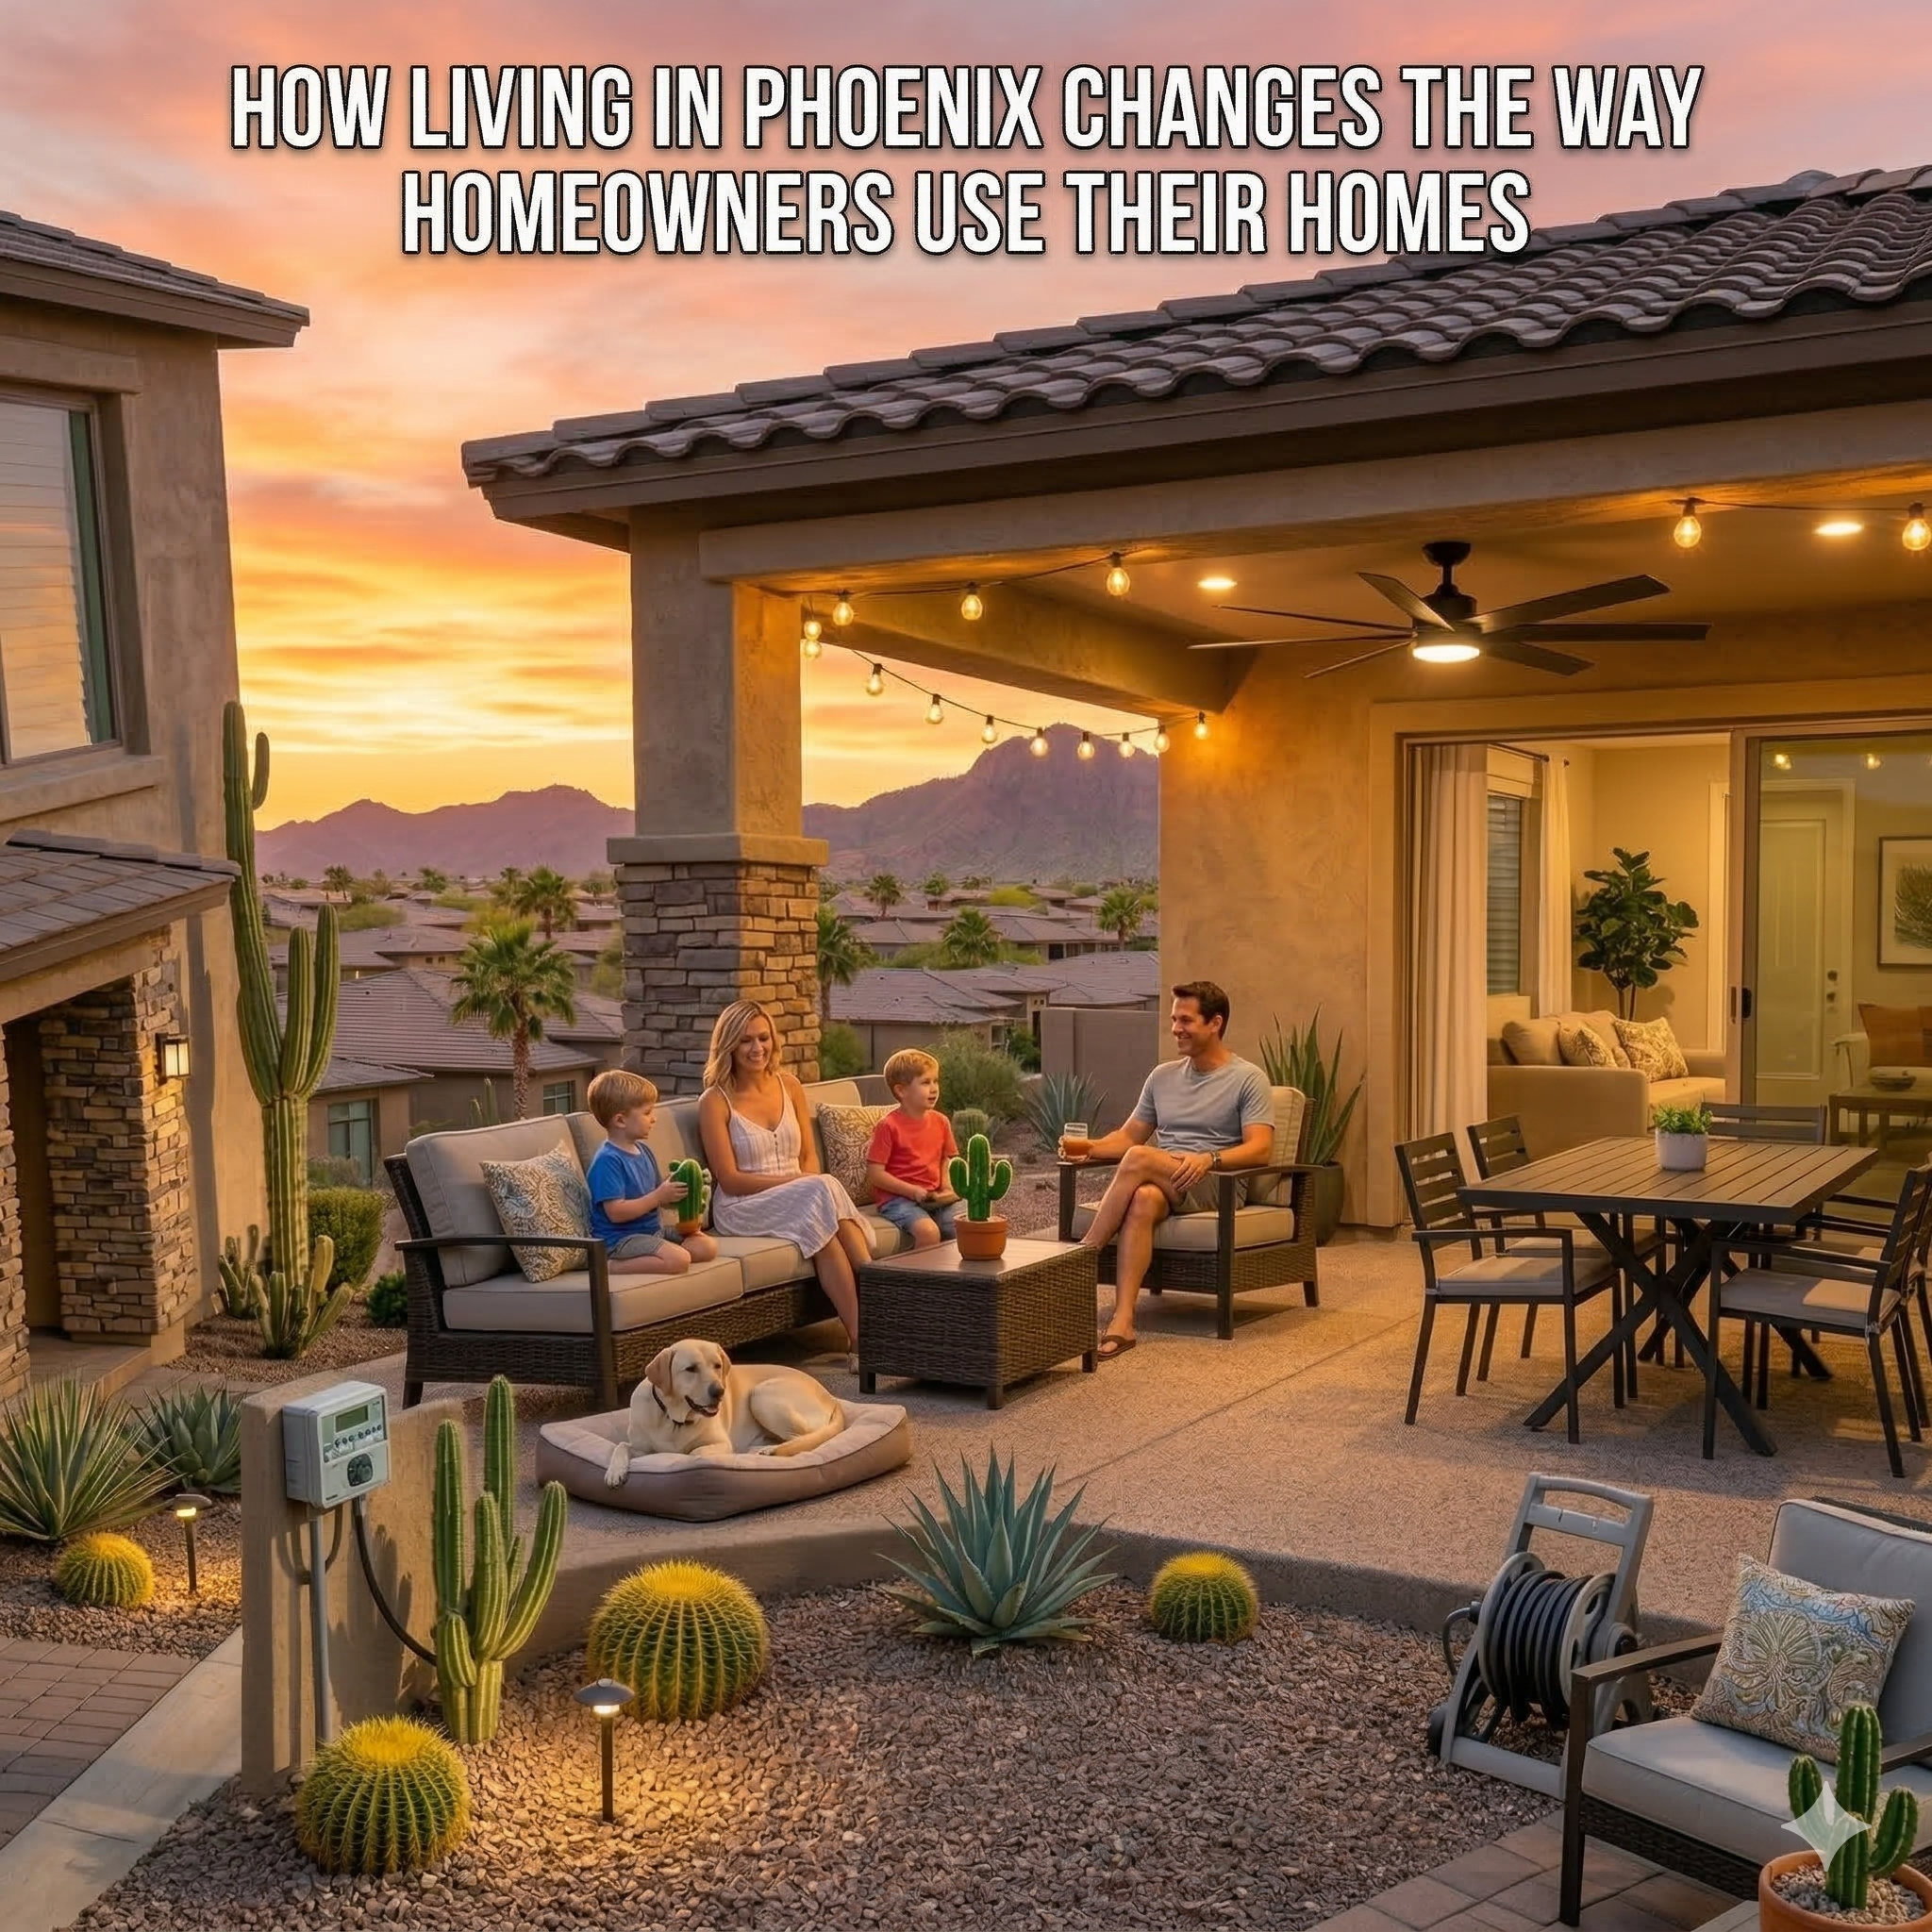
How Living in Phoenix Changes the Way Homeowners Use Their Homes
-
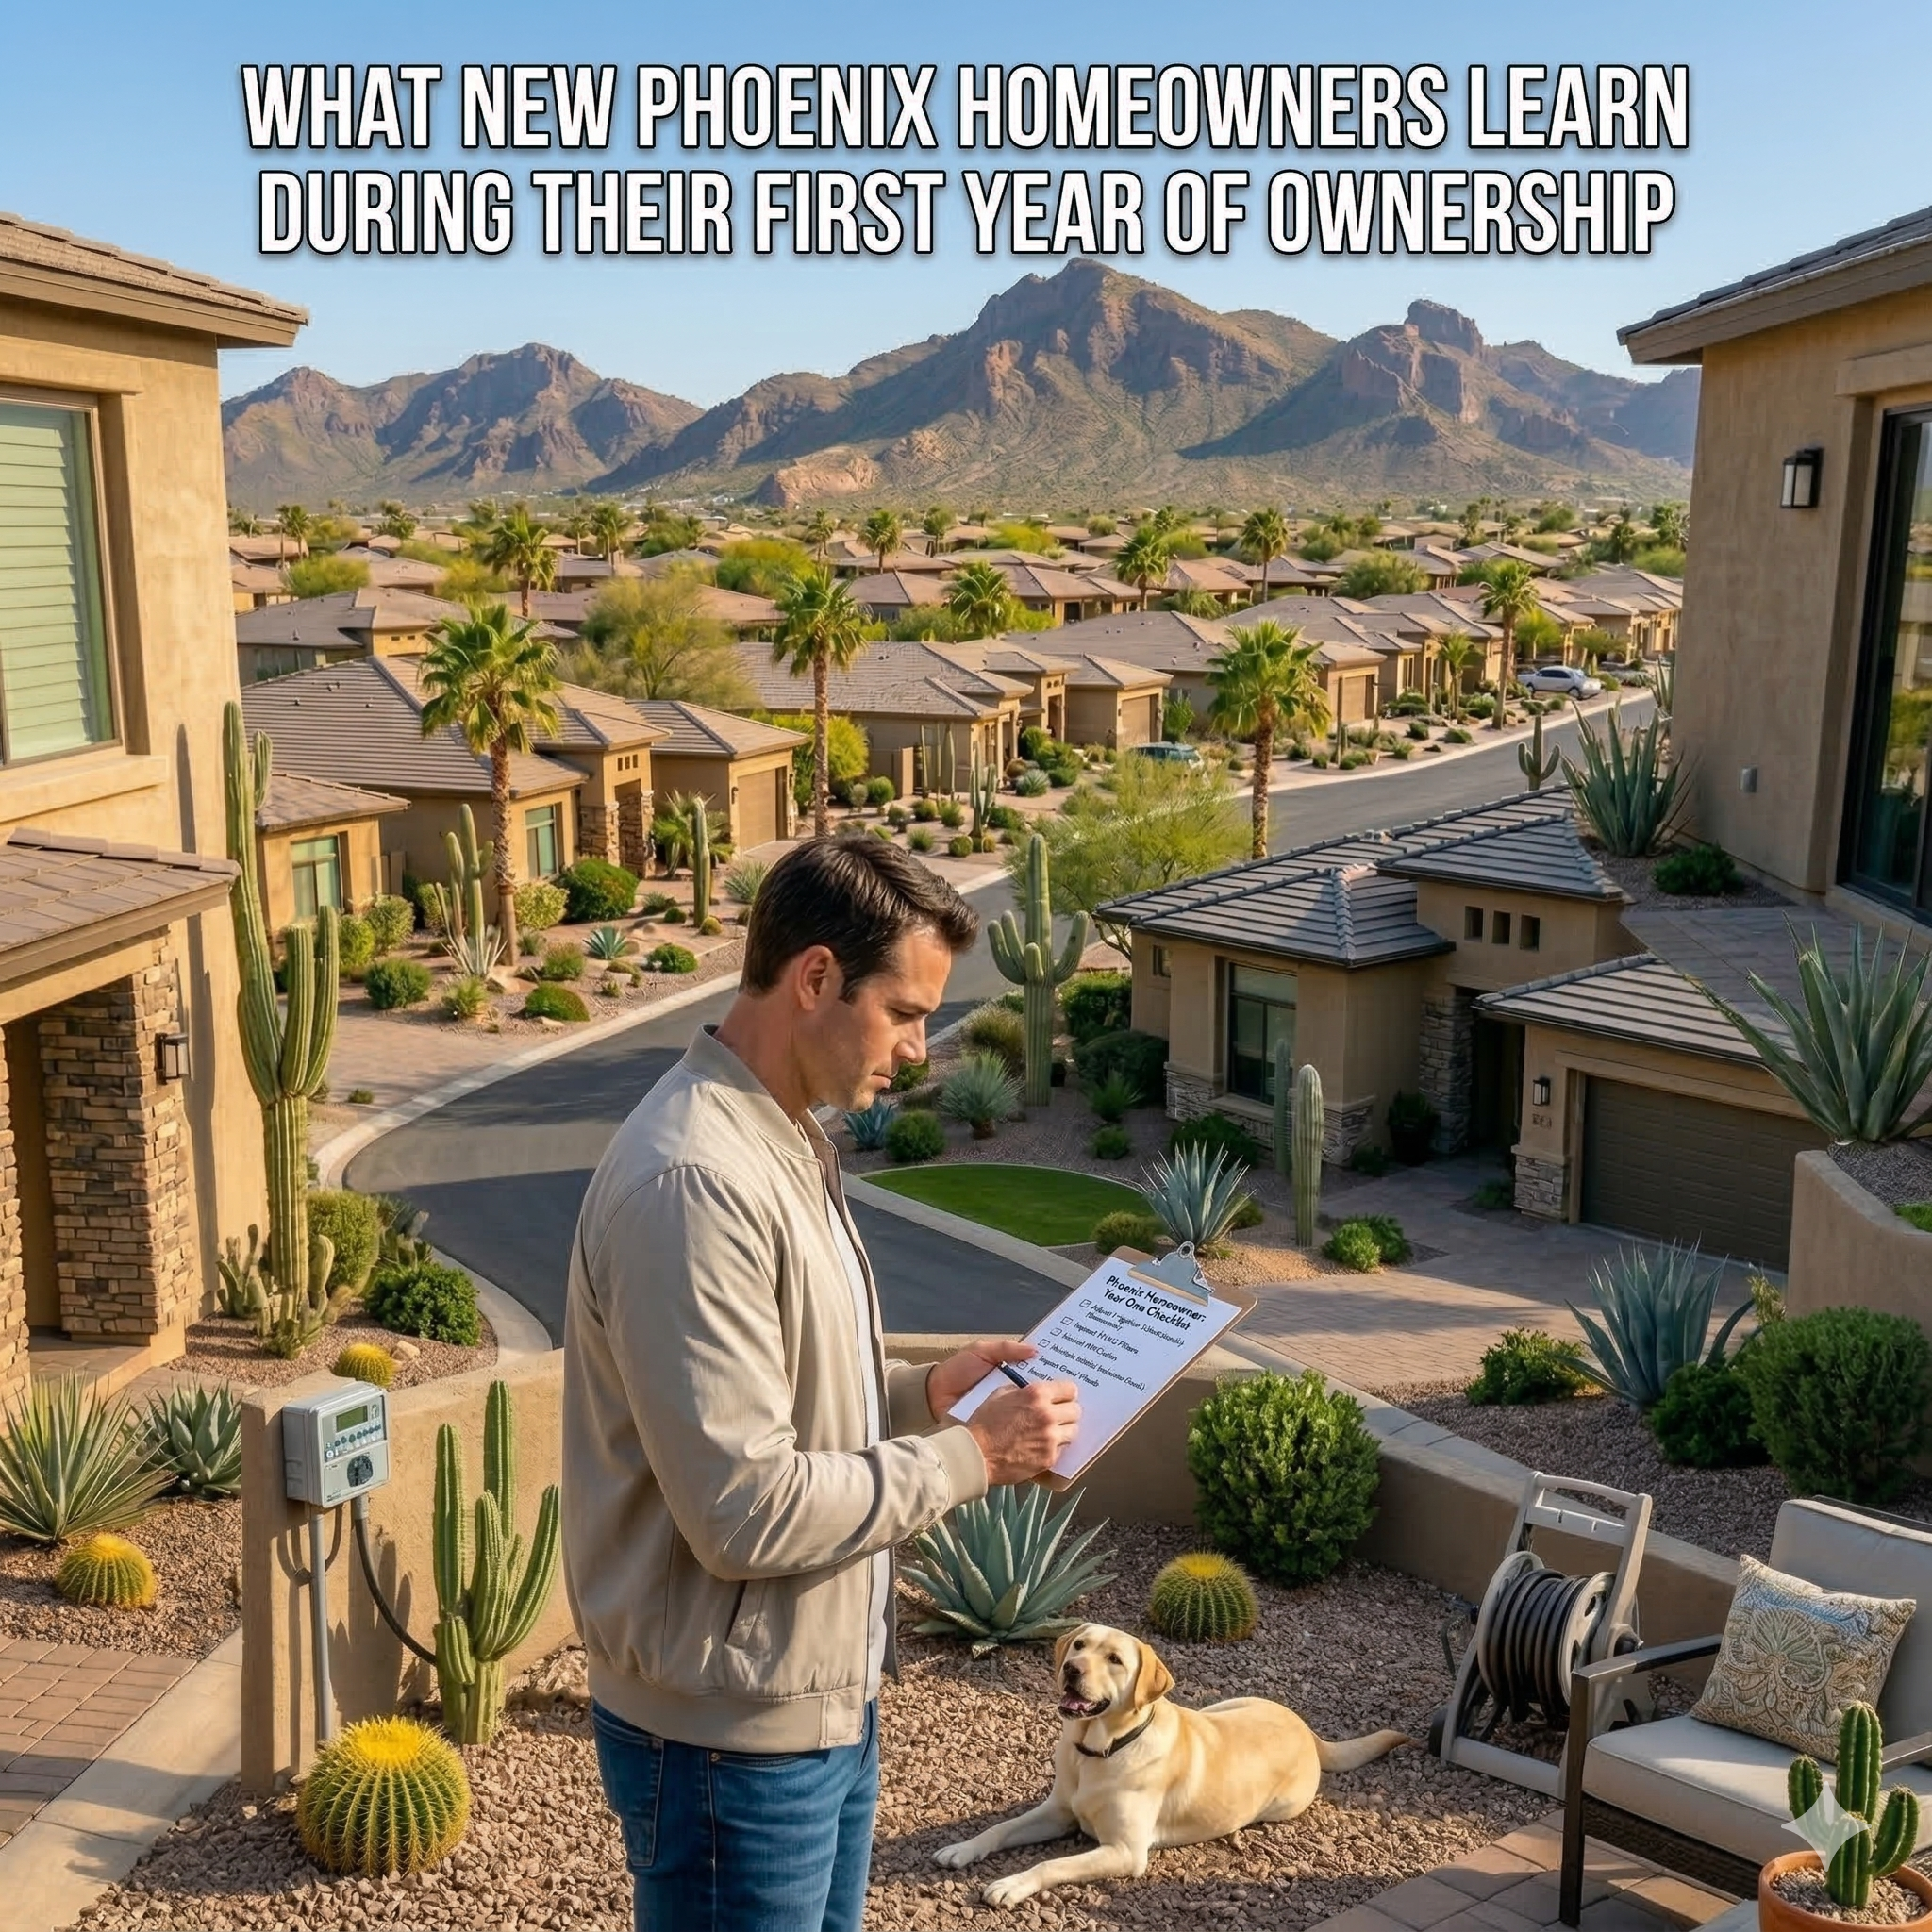
What New Phoenix Homeowners Learn During Their First Year of Ownership
-

How Daily Life Changes After the First Year of Living in a Phoenix Home
-
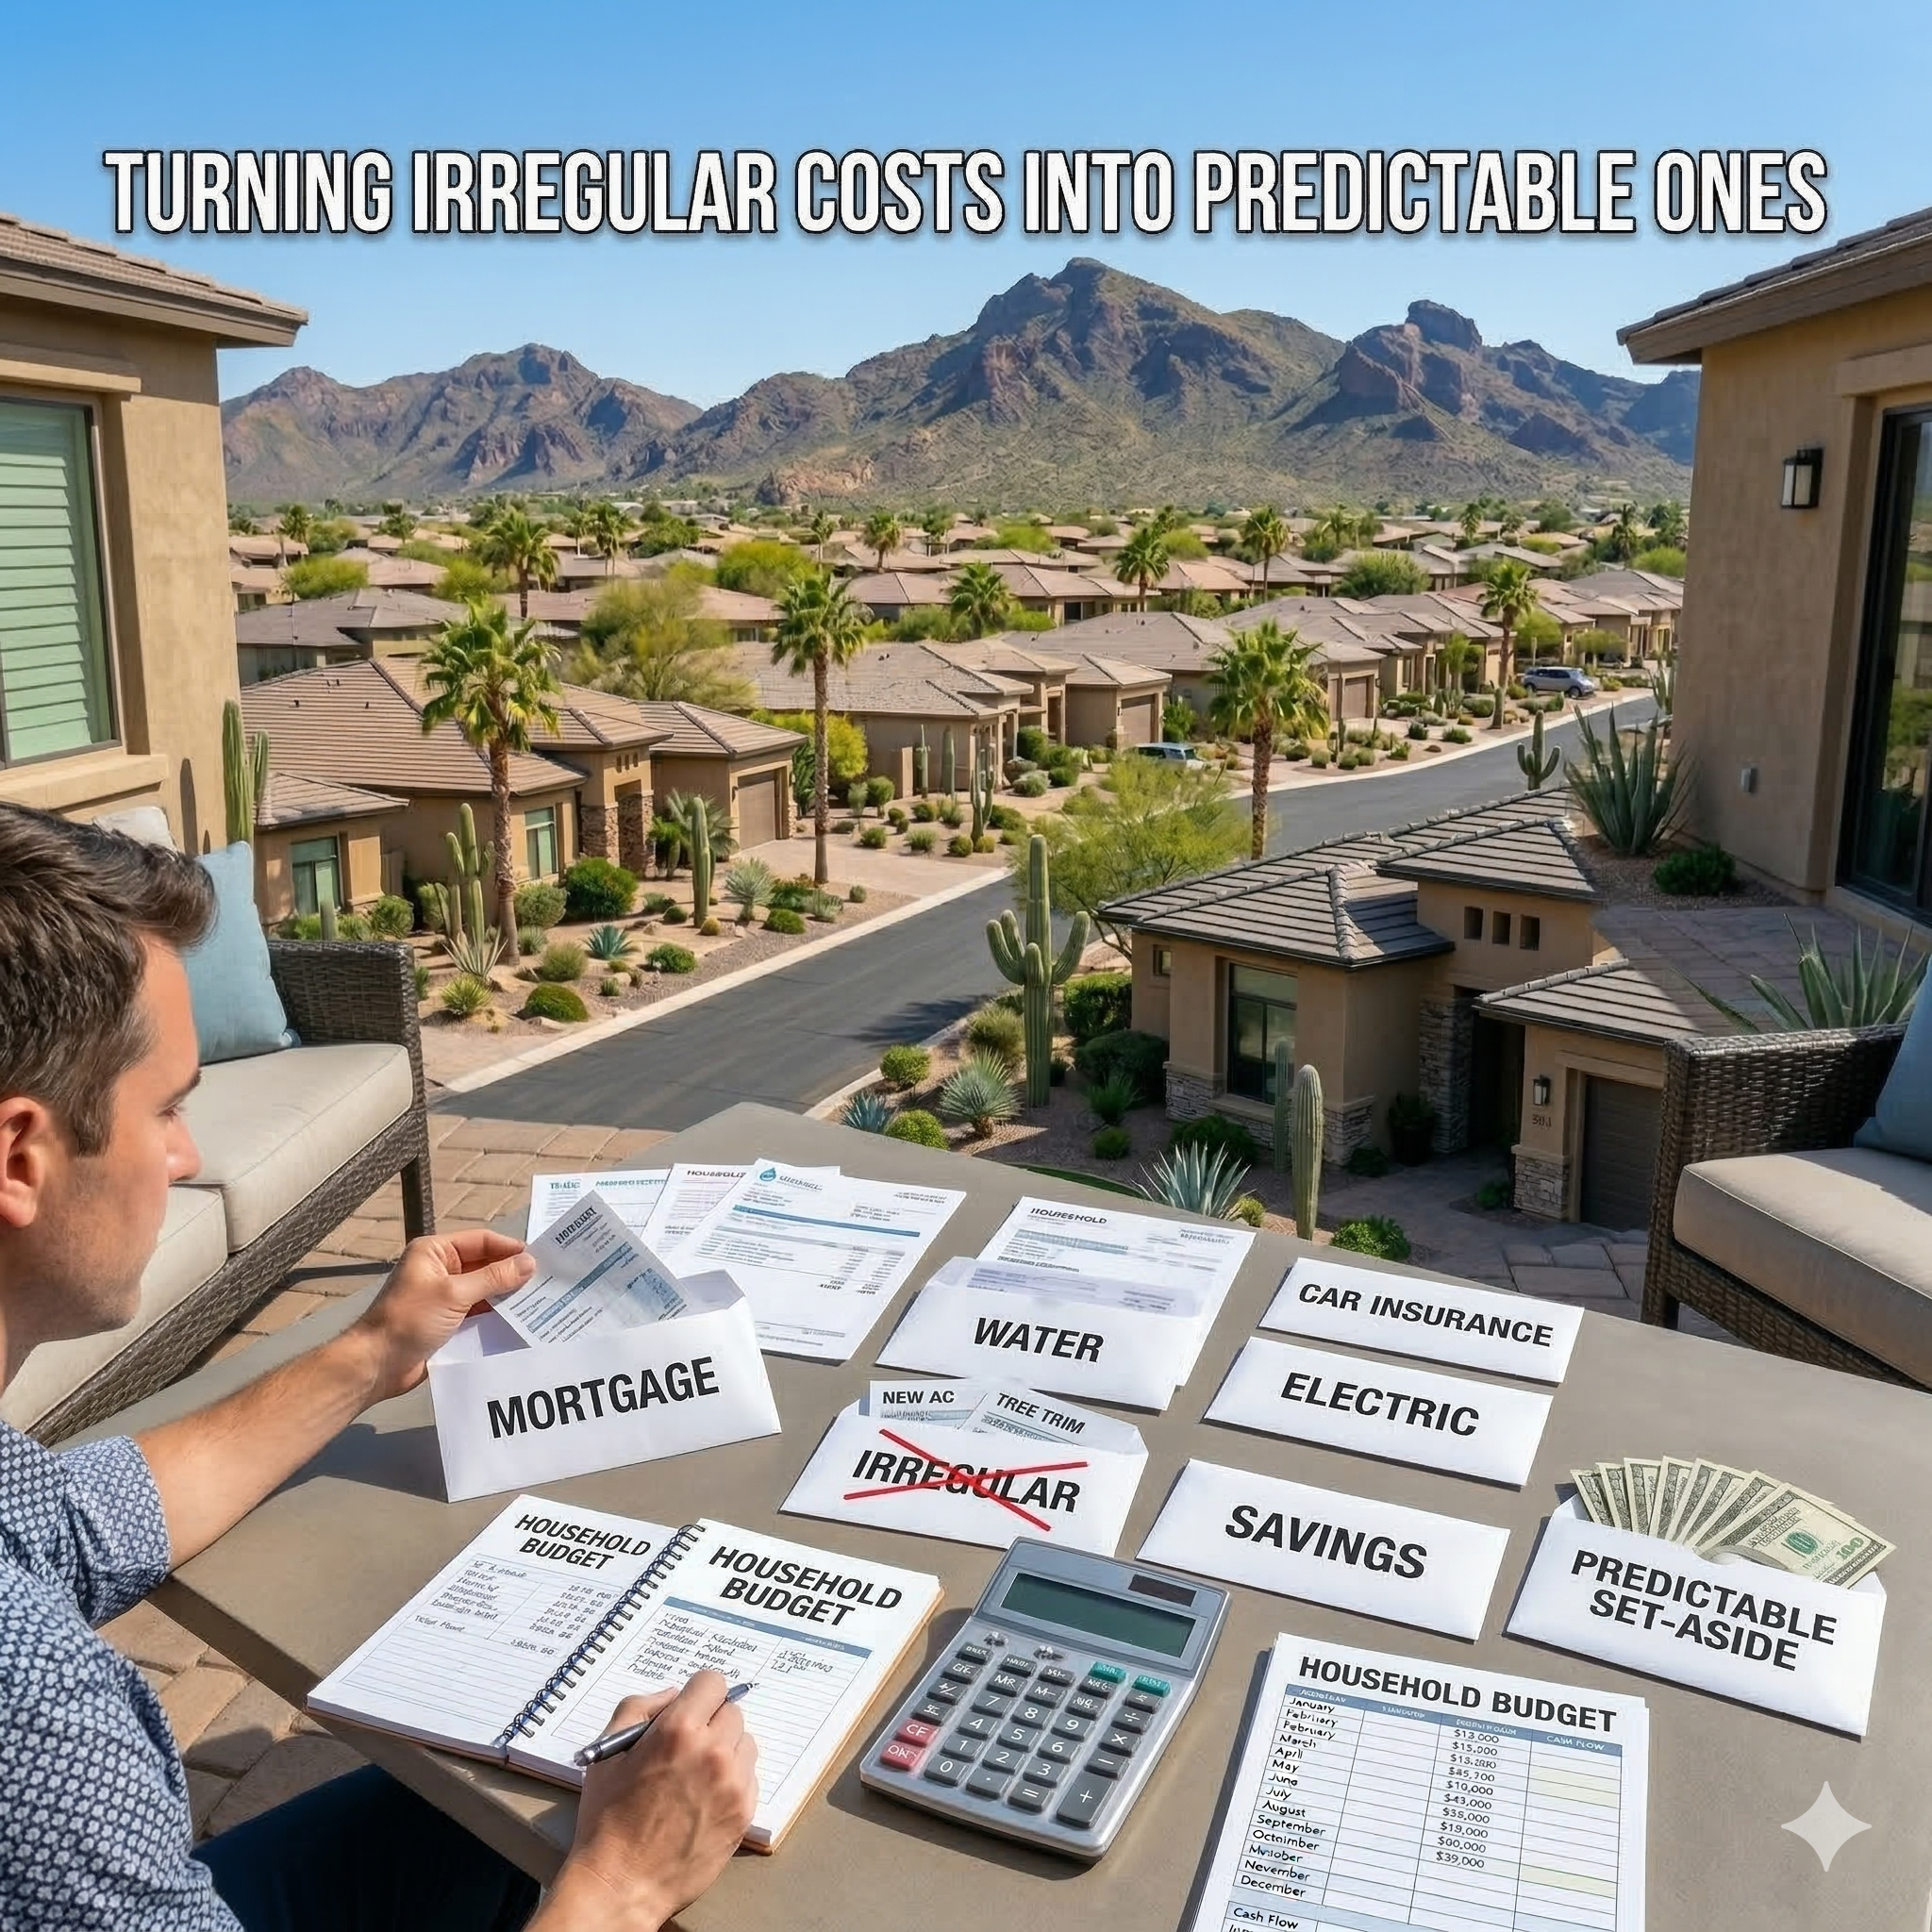
Turning Irregular Costs Into Predictable Ones
-

Budgeting for Ongoing Ownership
-
Repair vs Replace vs Defer Decisions
-

Planning Homeownership Like a Long-Term Asset
-

What Home Expenses You Can Safely Delay
-

Stopping Cost Creep Early
-

Cash Flow vs Net Worth Stress
-
Why “It’s Not That Much” Adds Up
-

Warning Signs Your Ownership Budget Is Tightening
-

The Cumulative Cost of Small Home Repairs
-

Designing Budgets Around Local Conditions
-
Utility Costs Over Time in Desert Climates
-

Insurance Increases Explained for Arizona Homeowners
-
How Inflation Impacts Phoenix Homeownership Costs
-

Avoiding Debt-Driven Homeownership Decisions
-

Replacing Systems on Your Timeline
-

Why Emergency Repairs Cost More
-

Timing Major Expenses Without Financial Shock
-
How Much to Keep in a Phoenix Home Reserve Fund